
Mobile Push Report
Mobile Push campaign reports provide information about the campaign results, including key metrics and operating systems of the message recipients.
You can also check out:
Let’s consider the features of broadcast reports.
Conventionally, the report consists of 4 parts:
- General information.
- Performance indicators.
- Conversions.
- Detailed statistics.
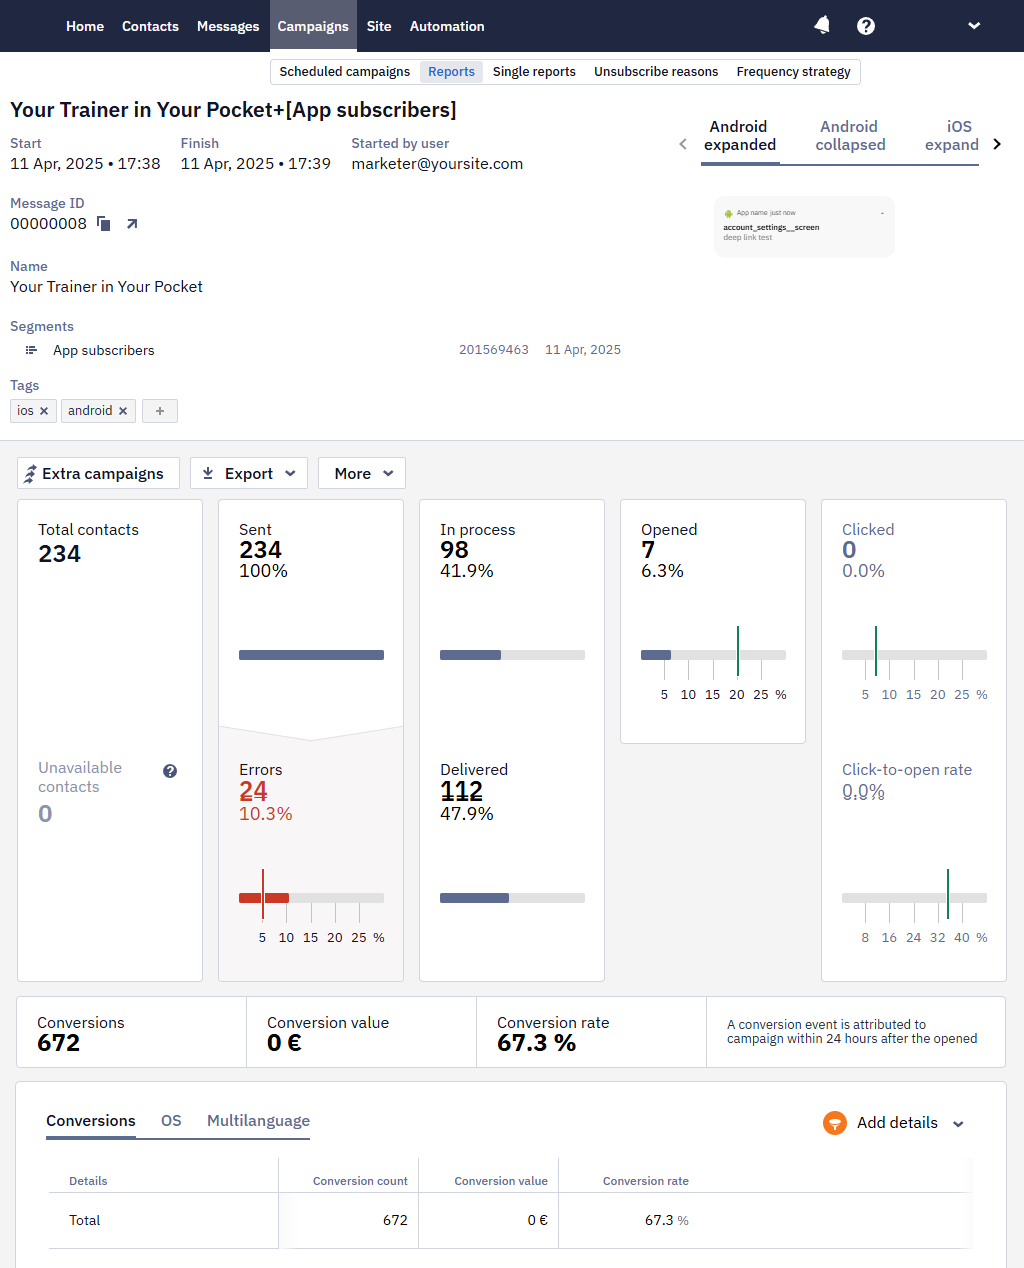
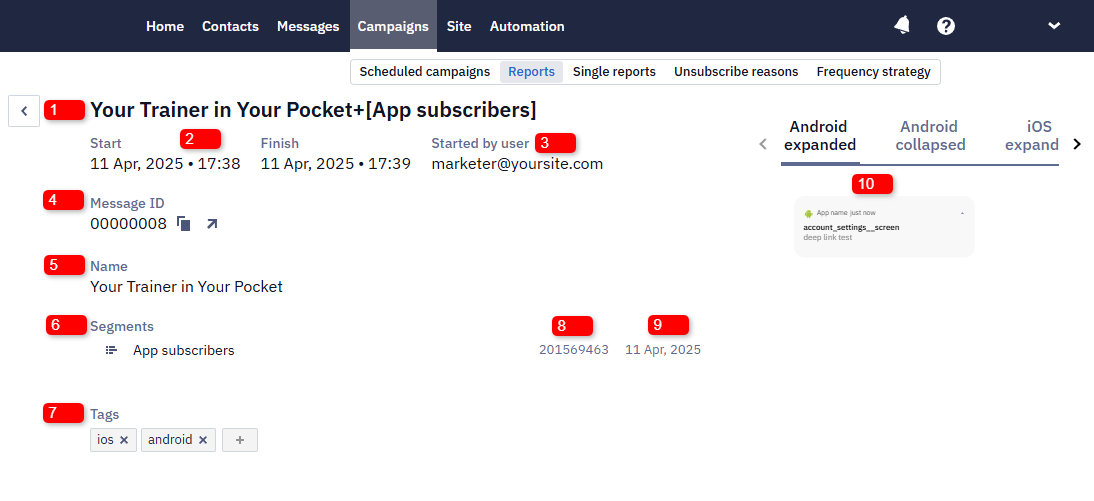
1. General Information
The first part of the report contains the following data:
- The message’s and segment’s names.
- Campaign start/finish date and time.
- Email of the user who started the campaign.
- Message ID. To copy an ID, click on the copy icon next to it. Click on the link icon to edit a message.
- Message name.
- The segment of contacts to whom the message was sent.
- Tags for search and filtering of messages.
- Segment ID.
- Date of segment’s last editing.
- Message preview across operating systems.
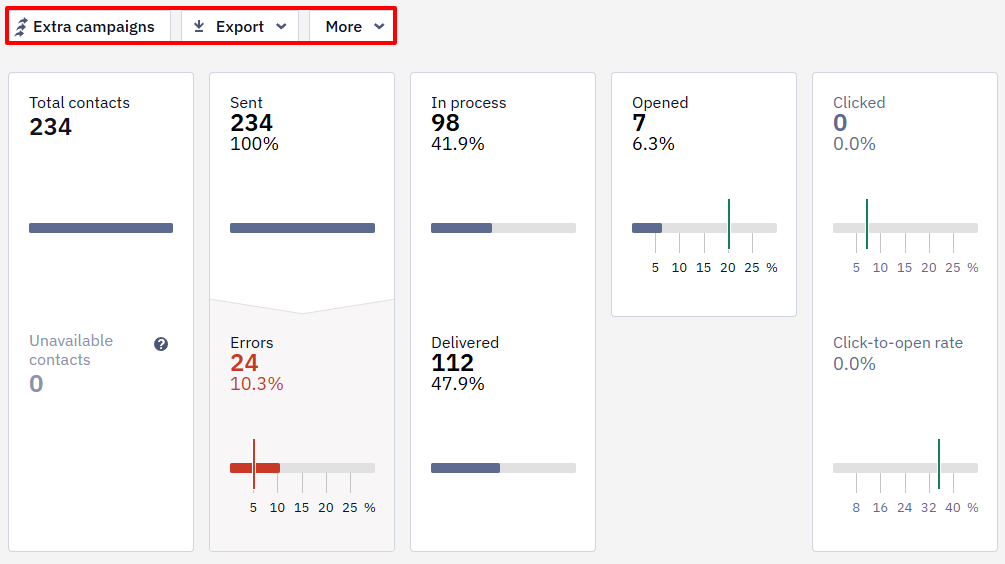
2. Performance Indicators
Reteno automatically tracks push campaign performance metrics, including clicks, errors, and more. All statistics are collected in a table.
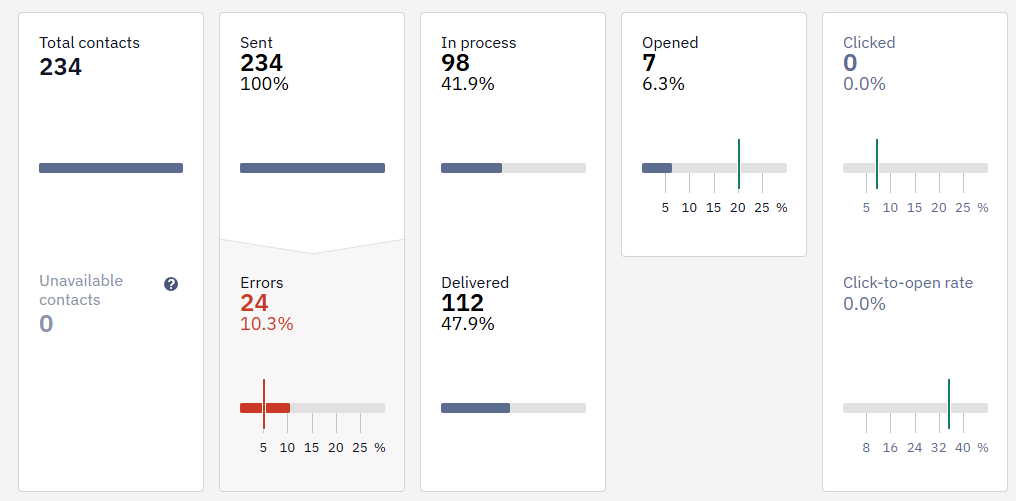
Green marks on the scale show the conditional indicators of a successful campaign, and red marks are negative indicators' conditional norm.
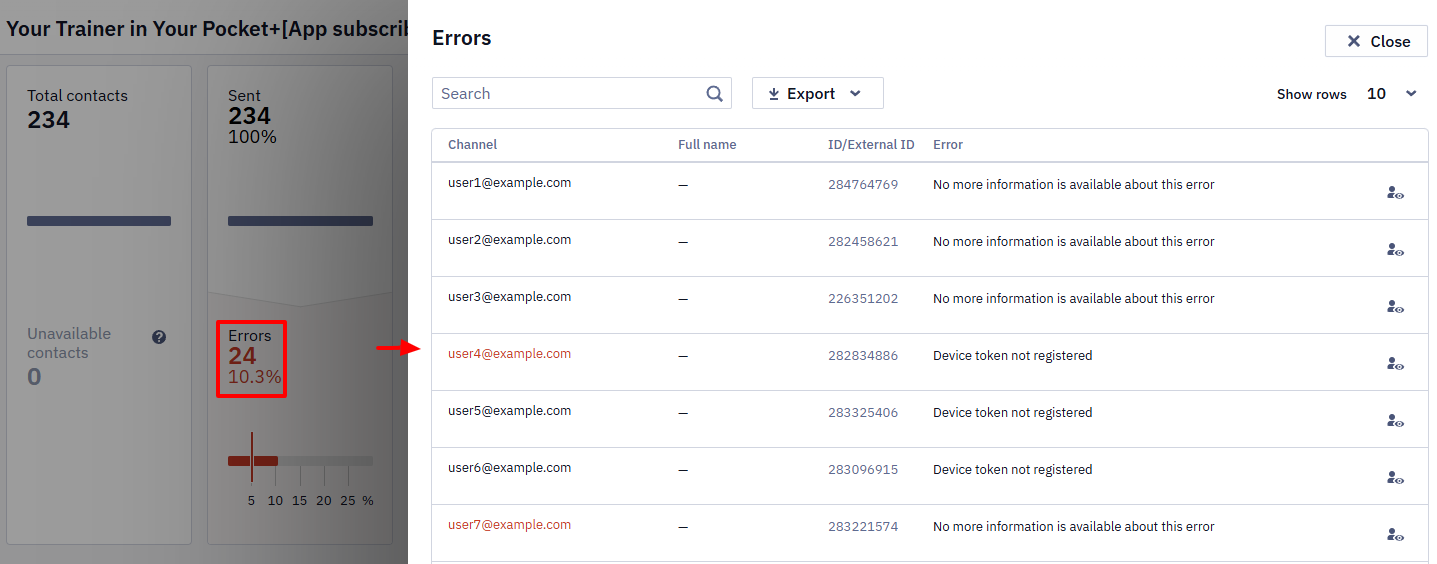
Clicking on any report item opens a window for viewing the contacts list.
Above the general statistics are the following tabs:
- Extra campaigns. Allows you to configure the automatic sending of messages based on the activity or inactivity of users regarding this campaign. More — at the link.
- Export. Allows you to export contacts from the report to a CSV file, to an existing or a new list. Export is available for all campaign metrics: sent, delivered, inaccessible contacts when sending, over plan limit, annoyance level exceeded, etc.
- More. Allows you to delete the report.
NoteFor Mobile Push + In-App bundle messages, the click event is not tracked on the Mobile Push side — clicks are attributed to the In-App report. For standalone Mobile Push messages, the click event is tracked as usual.
3. Conversions
If you define user events as conversion events and set up their display, you will be able to evaluate the conversion results of the campaign.
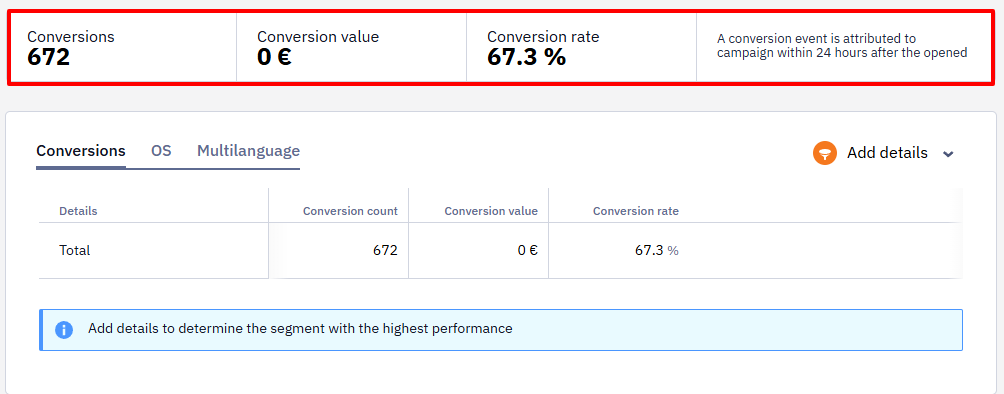
More on the settings for displaying conversion >
4. Detailed Statistics
The section includes information about the conversions, operating systems of contacts, and optionally, data on the effectiveness of the message's language versions (if used).
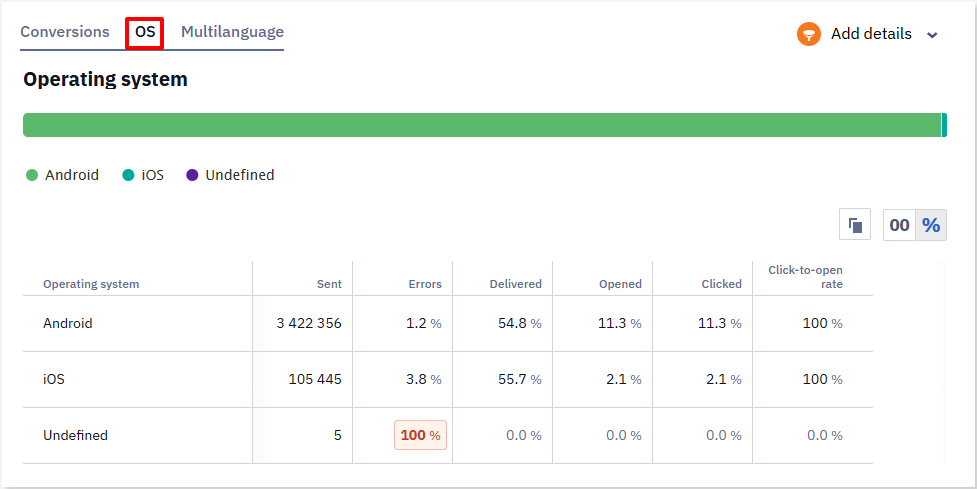
OS
See how users of different operating systems reacted to the campaign.
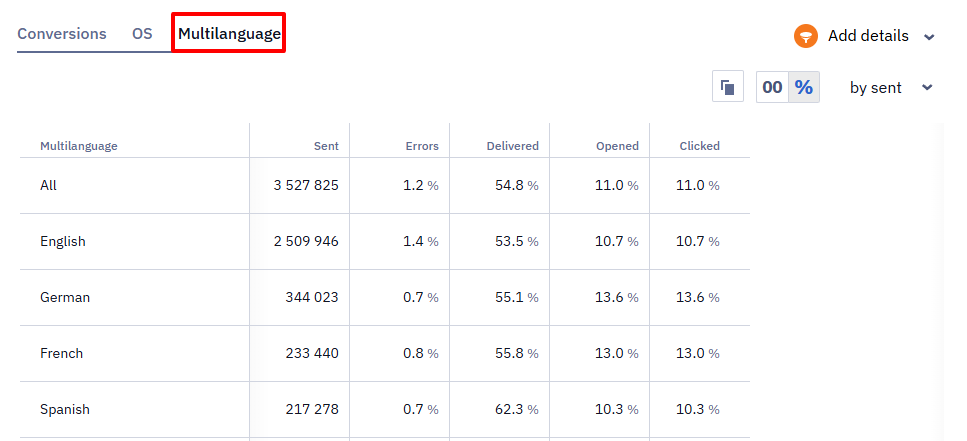
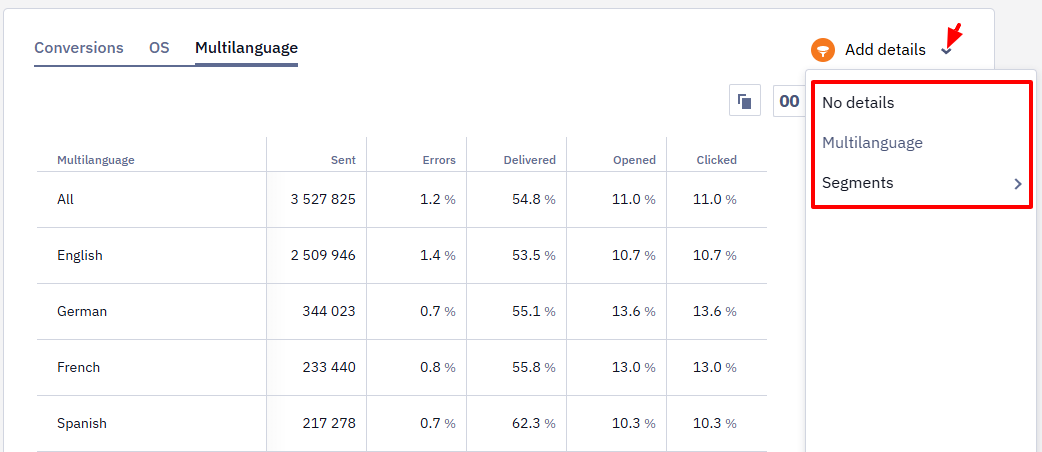
Multilanguage (optional)
Multilanguage is an automation tool that enables sending messages in different languages within one campaign. It helps avoid long message lists and voluminous unsystematic reports for every message.
Reports on multilingual campaigns are described in a special article.
Adding Details
You can filter tabs’ data using the Add details option.
Updated 6 days ago