
Contacts Analytics
Contacts analytics contains detailed information about the number of contacts and their details since they were created in the Reteno database.
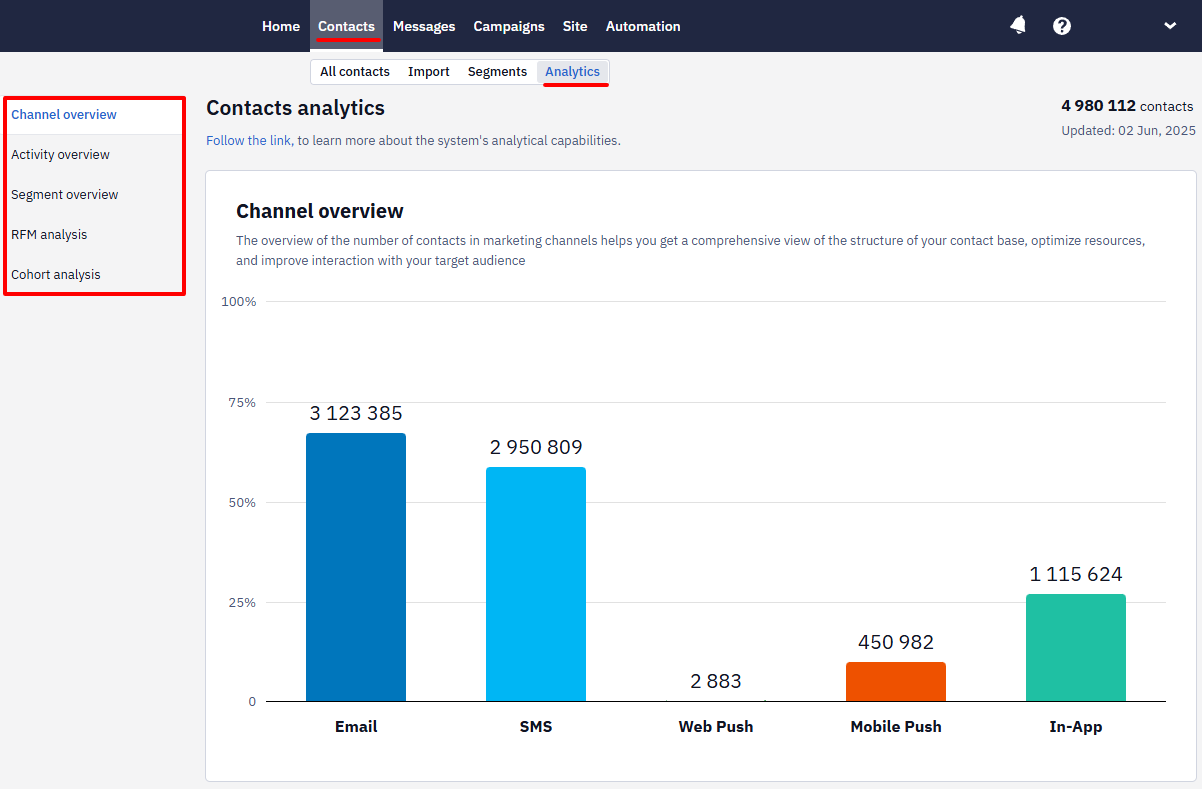
To view the statistics, go to Contacts → Analytics, and select one of the sections from the left-hand menu:
- Channel overview
- Activity overview
- Segment overview
- User lifecycle
- RFM analysis
- Cohort analysis
Let's consider each section in more detail.
Channel Overview
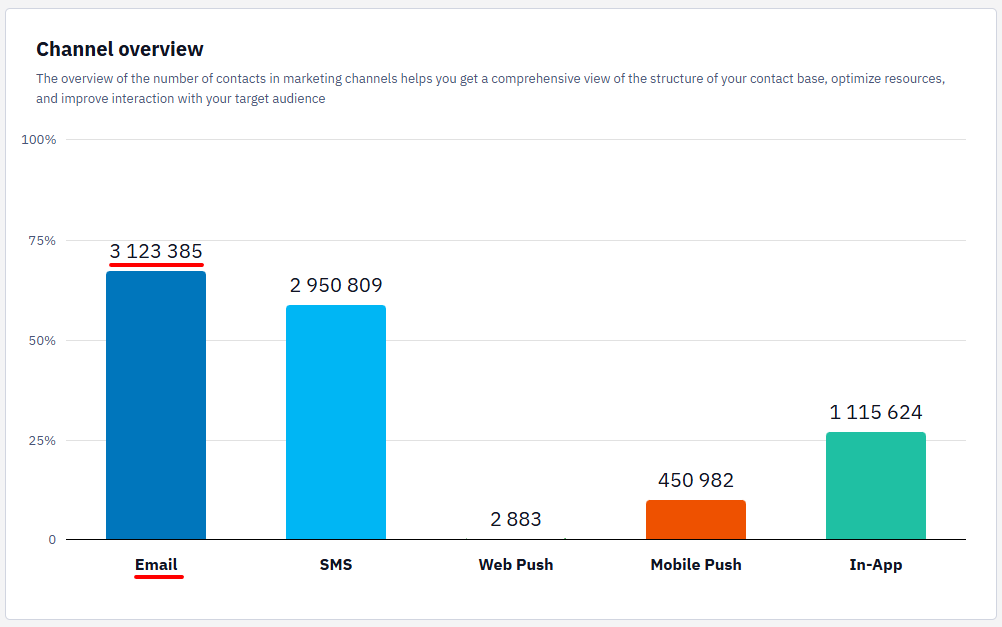
The chart shows the distribution of contacts by channels, with the number of contacts in each. If a channel is missing from the database, its field will not be displayed or included in the calculations
NoteThe overview shows statistics for the last elapsed day; recalculation ends before 02:00 UTC
Activity Overview
The section is divided into tabs by channels, where the following data is displayed for each channel:
- charts of the contact base by activity;
- contact growth overview;
- subscriber engagement overview.
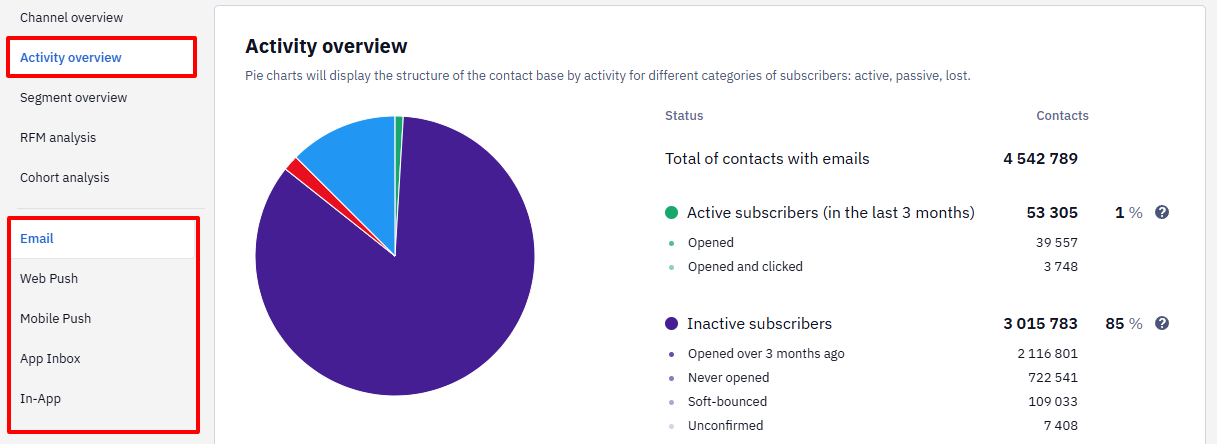
Charts of the Contact Base by Activity
The pie chart displays the contact database structure based on the activity of different subscriber categories. All elements of the chart are interactive and color-coded: clicking on any segment reveals its structure in the selected channel.
Email
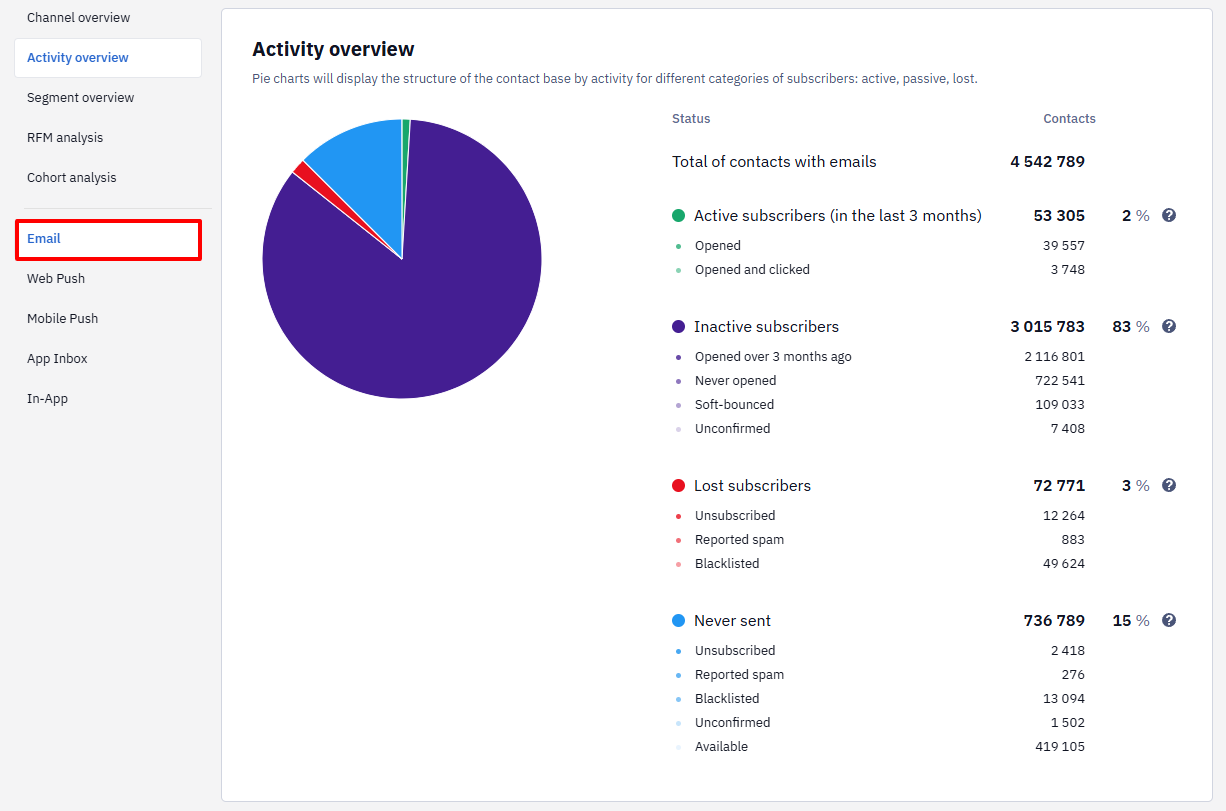
Statistics categories:
Active subscribers. Contacts included in the campaign in the last 3 months:
- opened;
- opened and clicked — opened and clicked the link from the email.
Inactive subscribers. Contacts who received the campaign but were not sufficiently engaged:
- opened over 3 months ago;
- never opened;
- soft-bounced — an email exists, but message delivery is impossible. For example, the mailbox is full, temporarily blocked, etc. If the status changes (for example, the email address becomes inactive after a year), such contact will fall to the Black List category;
- unconfirmed — contacts who indicated their email in the subscription form but did not confirm it. The reasons may differ — an error in the address, filling out the form by a bot, etc.
Lost subscribers. Contacts that previously participated in campaigns but are now unavailable for the following reasons:
- unsubscribed;
- reported spam;
- blacklisted — you or another user sent messages to this address, and the mail service answered that the mail does not exist. Such an address is blacklisted and no longer participates in the campaign. The blacklist is end-to-end, that is, you upload an email address to the system, and it may already be on the blacklist.
Never sent. Contacts you have never sent campaigns to. For example, a contact was previously blacklisted or was accidentally removed from a campaign segment. Here you can see the following statistics:
- unsubscribed;
- reported spam;
- blacklisted;
- unconfirmed;
- available — addresses available for the campaign.
Web Push, Mobile Push, App Inbox, In-App
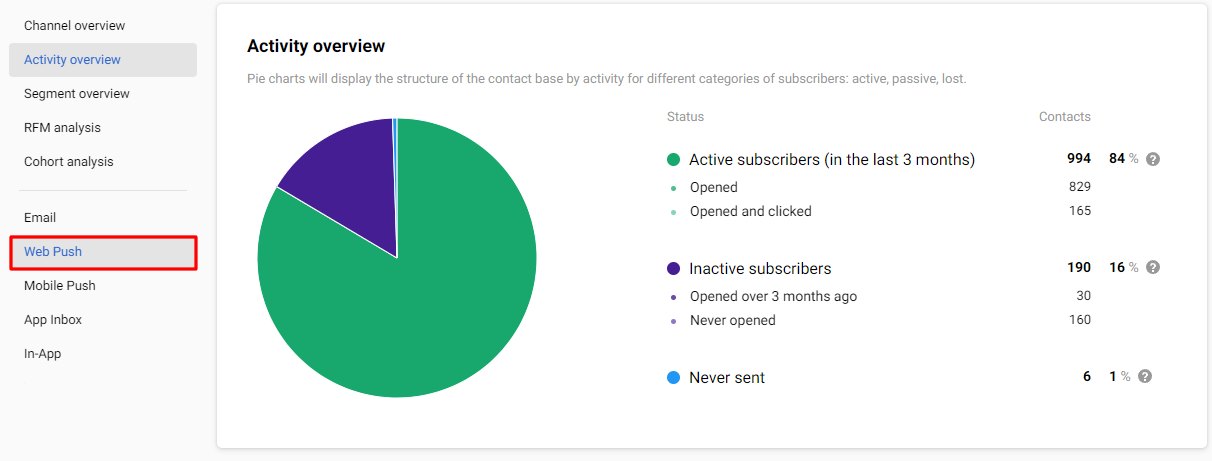
Let's examine the chart using Web Push as an example, as the statistics for the mentioned channels are built based on the same categories of contacts:
Active subscribers. Contacts included in the campaign in the last 3 months:
- opened (Web Push, App inbox and In-App channels);
- opened and clicked.
Inactive subscribers. Contacts who get the campaign but were not sufficiently engaged:
- opened over 3 months ago;
- never opened.
Never sent. Contacts you have never sent campaigns to.
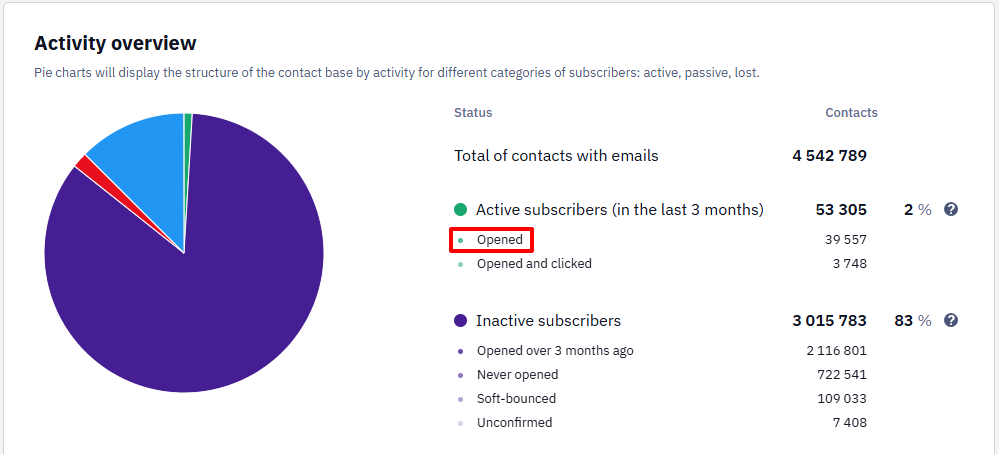
Exporting contacts with different activity statuses to the groups
Let's consider the export of contacts using the Email channel as an example.
- Click on the required field. For example, Opened field.
- Click the Create a segment button in pop-up window.
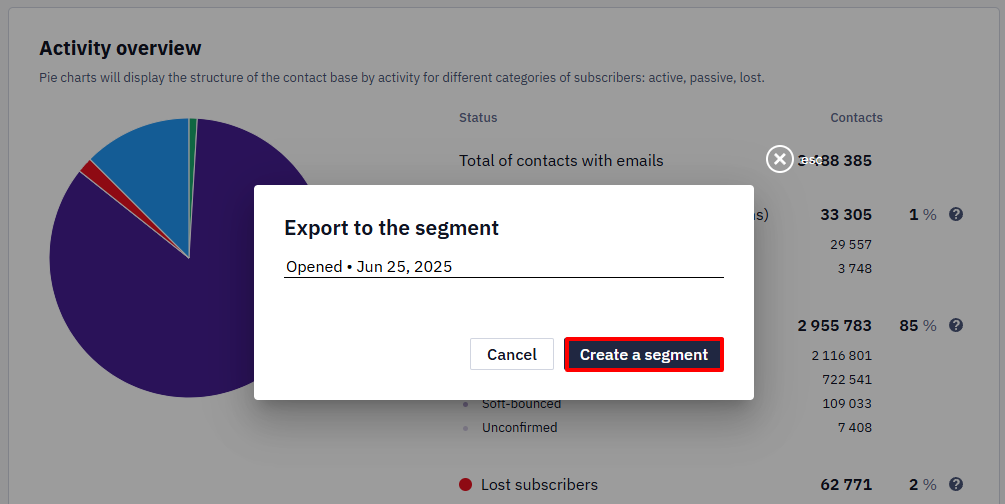
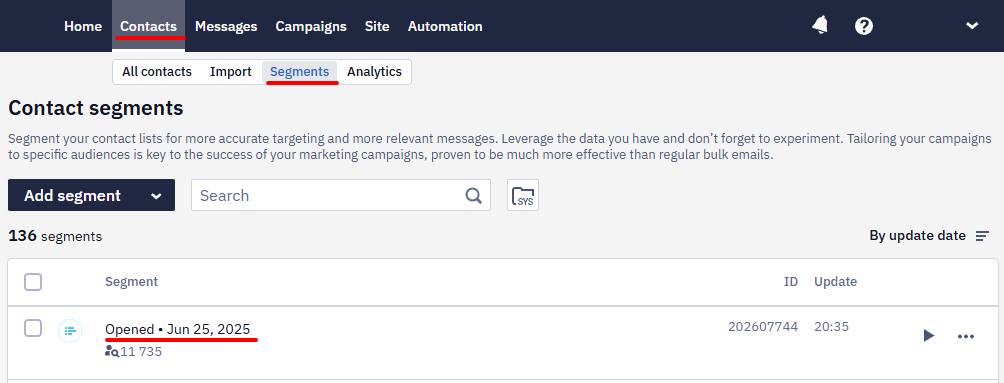
The segment will appear in the Contacts → Segments section in the overall list of groups. The contact data is current as of the moment of export to the segment.
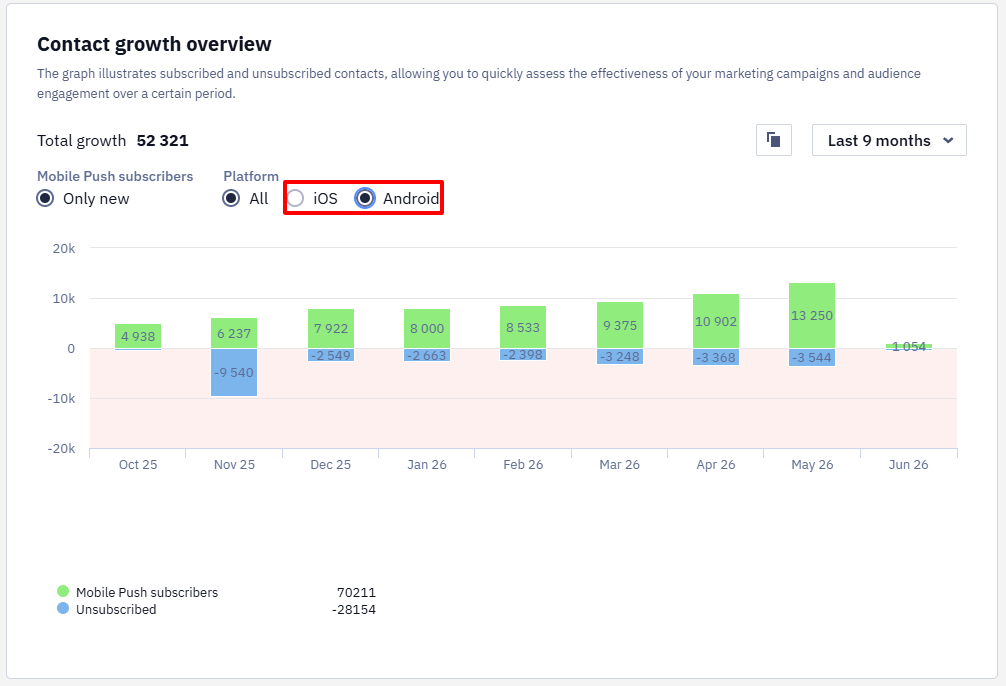
Contact Growth Overview
In this section, you can track changes in your contact database over a selected period using bar charts.
To view the statistics, click the channel tab and select the time range.
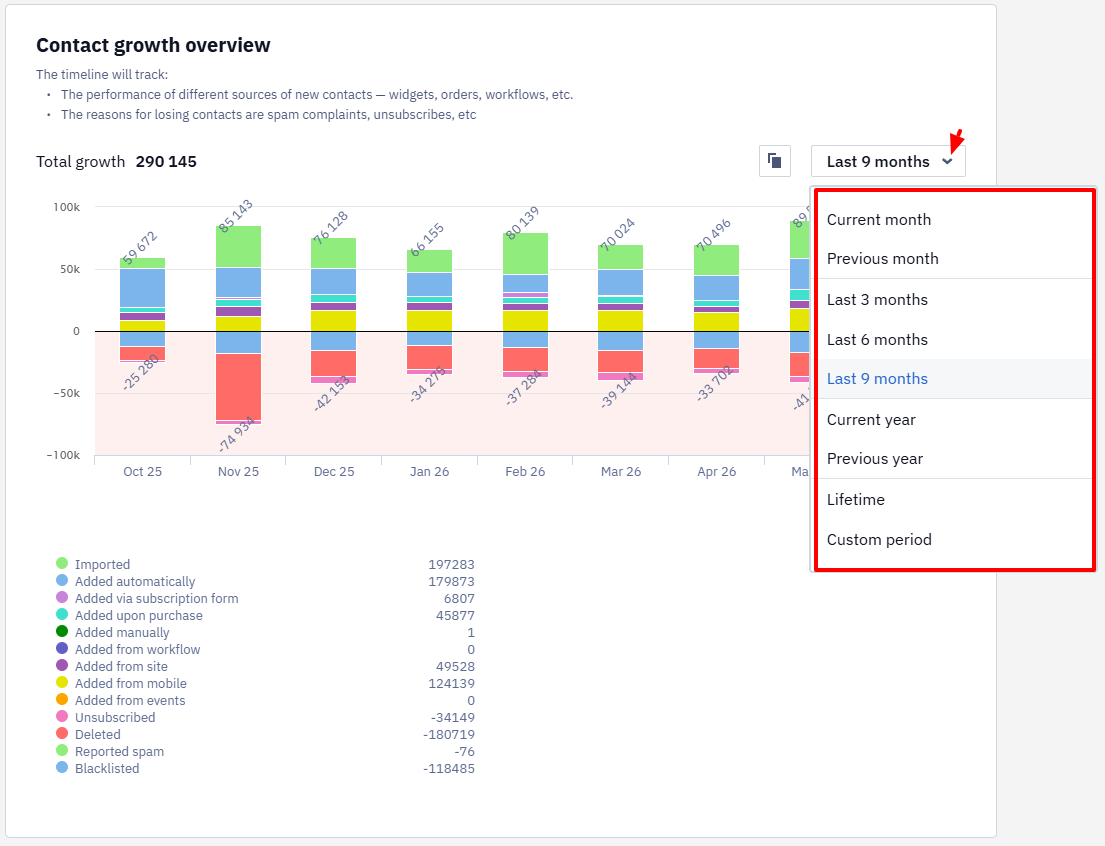
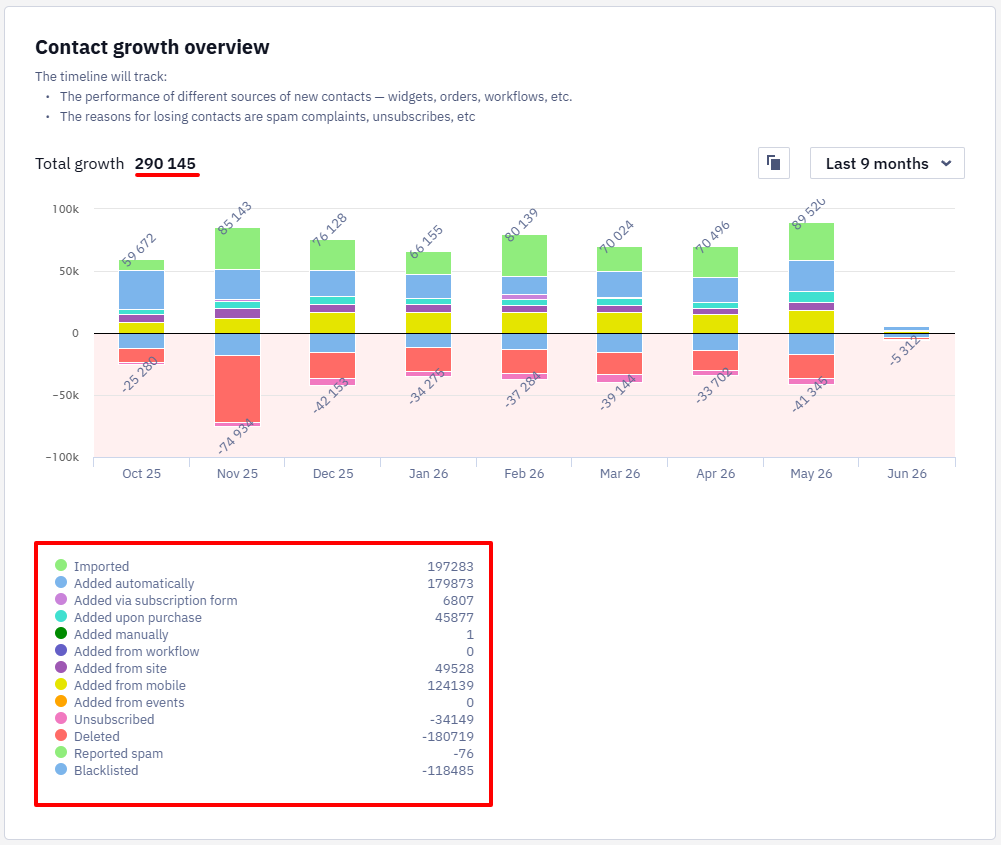
On the chart, you can see:
- The total number of contacts growth by channel.
- Contact categories are divided by their source of entry into the system or reasons for deactivation, with the number of contacts in each category specified.
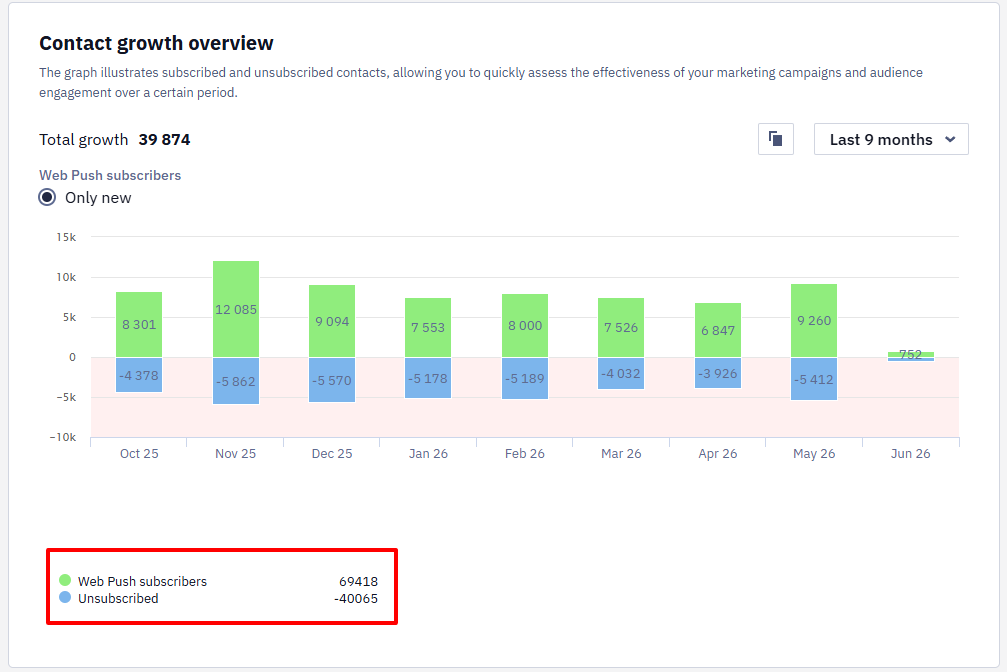
Categories for Web Push, Mobile Push, In-App channels:
- Subscribers
- Unsubscribed
To exclude a category from the chart, click on its name to deactivate it. Active values can be copied to the clipboard.

NoteContacts added from events are created using the Generate event v3 method, provided that segmentation is enabled for the event
The growth dynamics for Mobile Push and In-App displays statistics separately for Android and iOS.
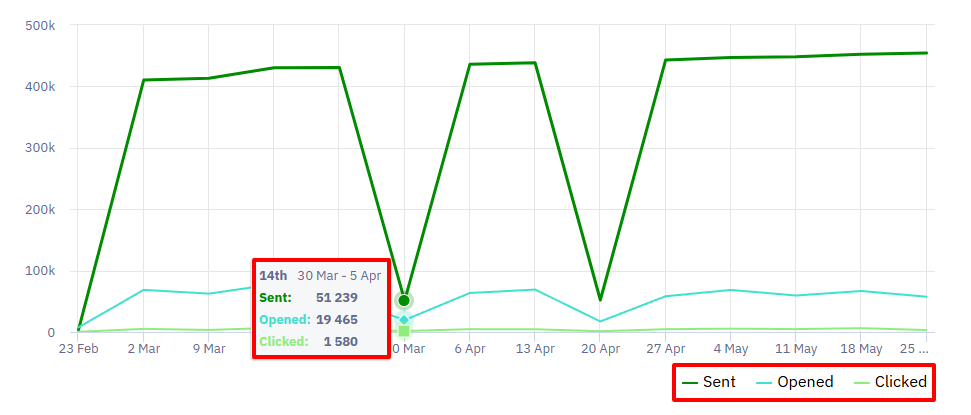
Subscriber Engagement Overview
This section displays subscribers' reactions to campaigns as linear graphs, showing points with values when hovering over the graph.
Statistic time for all channels — 3, 6, 9, and 12 months. Also, you can set the time interval for a specific period.
The top graph allows you to assess the level of interaction with the audience and contains the following categories:
- Sent, opened, and clicked — for Email, Web Push, and In-App channels
- Sent, clicked — for Mobile Push channels
- Opened, clicked — for App Inbox channel
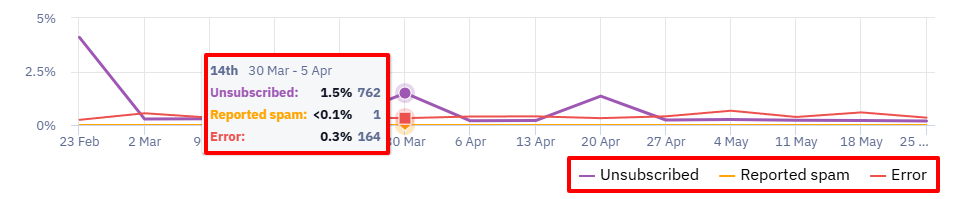
The bottom graph indicates issues or deficiencies that require attention and possibly adjustments in the communication strategy, containing the following categories:
- Unsubscribed, reported spam, error — for the Email channel.
- Error — for all other channels.
Segment Overview
The table shows growth dynamics in specific segments.
NoteYou can add any segment to collect statistics. The system starts collecting the segment’s statistics for this chart from the day you add it.
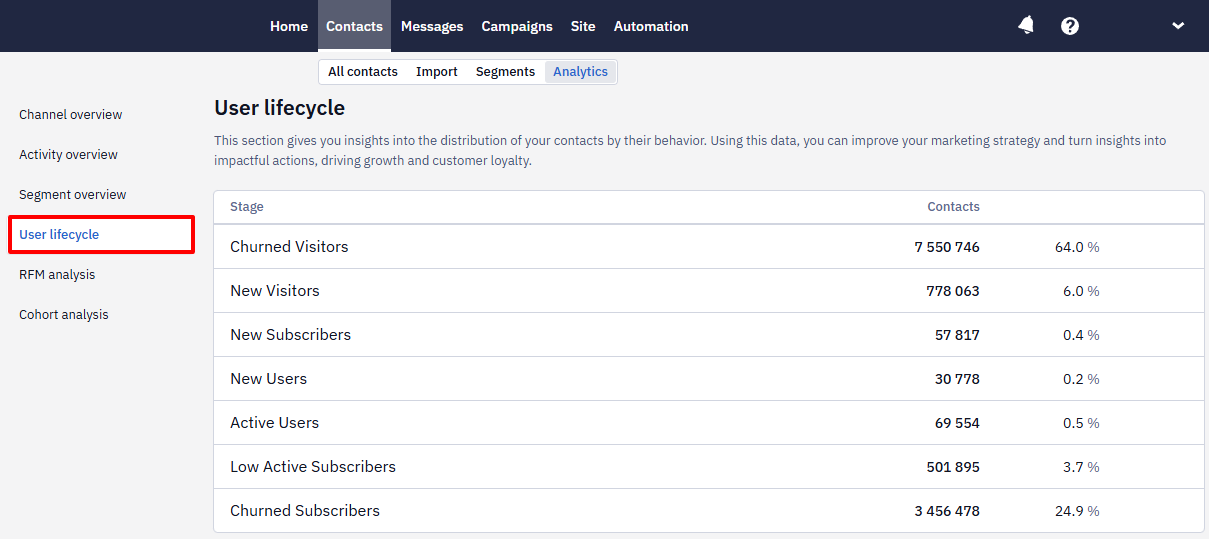
User Lifecycle
The User lifecycle tab visualizes information about the distribution of your users by stages in absolute and percentage terms.
- New Lead
- New Users
- Active Users
- Dormant Users
- Churned Users
The distribution is based on
- In-app Events, like Session started, Lesson completed, Subscription purchased,
- Values from additional user fields, such as the creation date, the number of completed workouts per week, subscription type, and more.
All lifecycle stages are presented in the conditions of dynamic segments, so you can precisely target your broadcast and trigger campaigns.
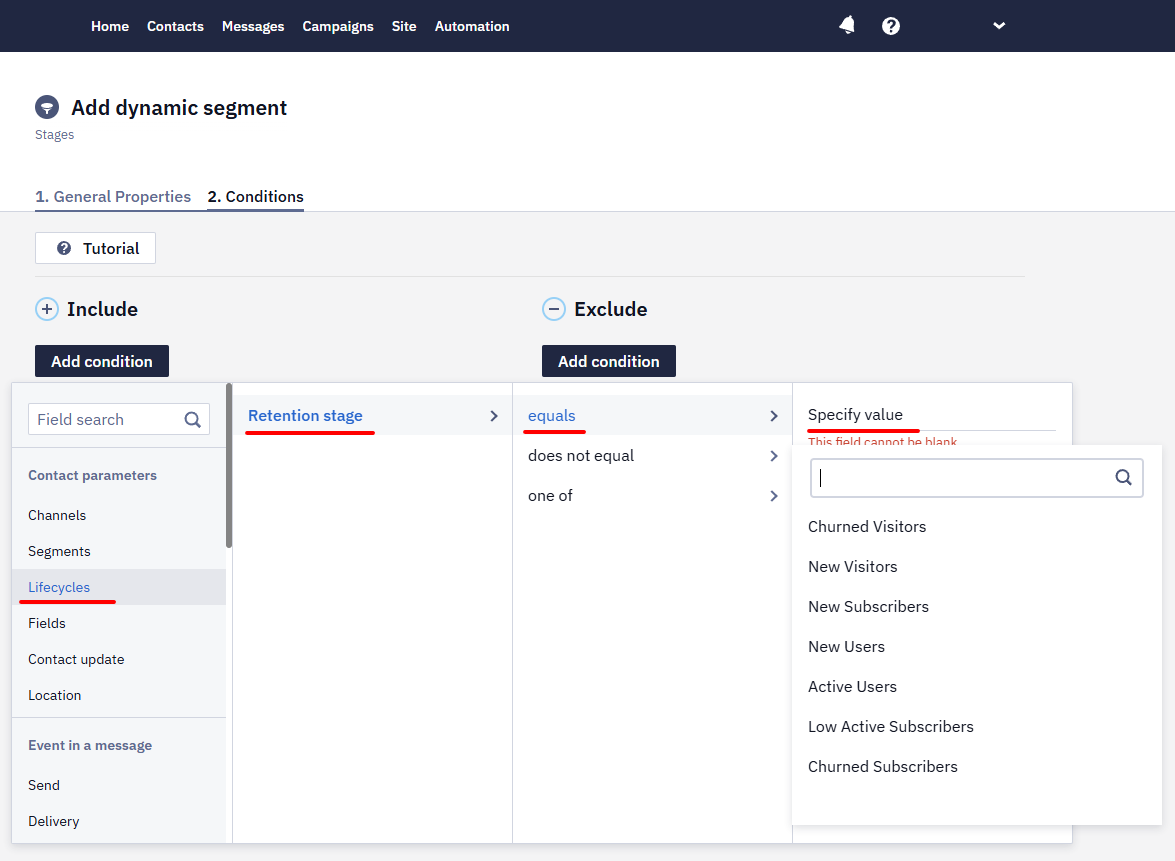
NoteSince each app has some differences in its user lifecycle, we create custom settings for each case. Please send a request to [email protected], and we will contact you to create a lifecycle model that accurately reflects your business's specifics.
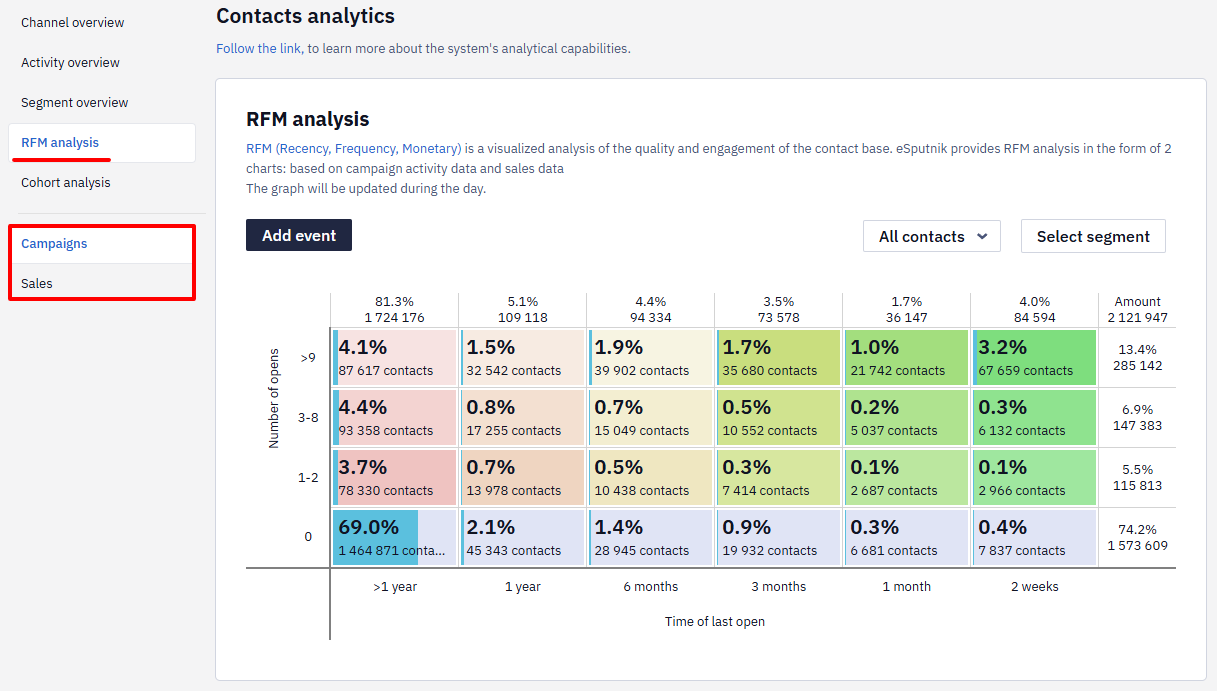
RFM Analysis
The analysis displays contact activity from two weeks to the entire period.
Campaigns and sales statistics divided into tabs.
Actions with the segments
RFM analysis table is divided into segments. You can do the following actions:
- export to segment;
- delete;
- create an event when the contact moves between segments.
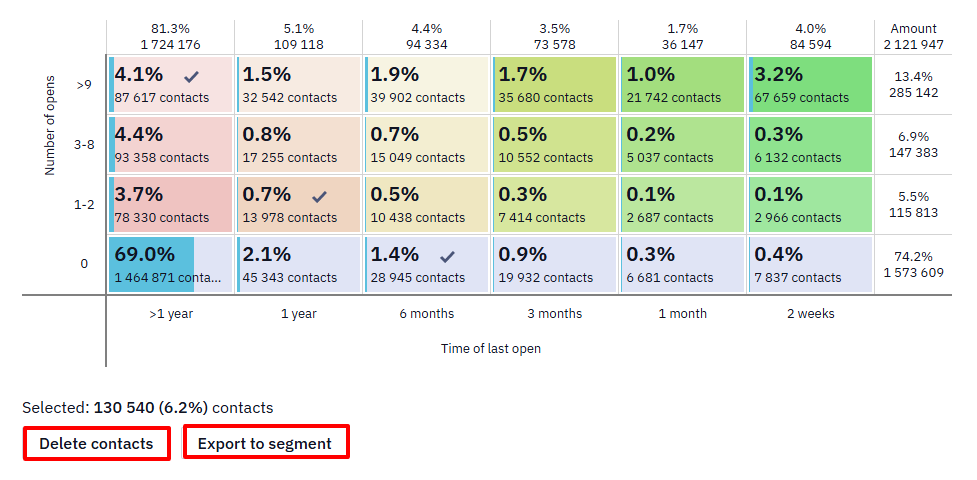
Export to segment/delete contacts
- Click one or more cells. The selected segments will be marked with a checkmark.
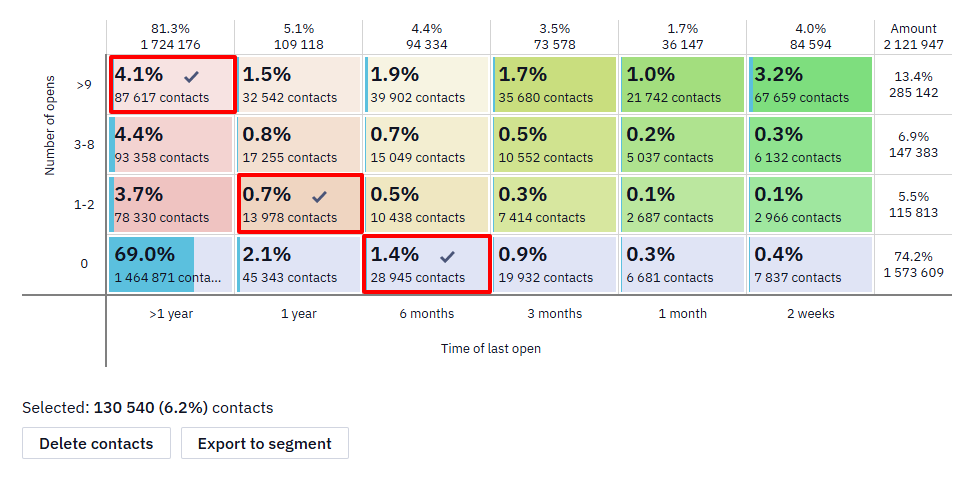
- Click the Export to segment or Delete contacts button.
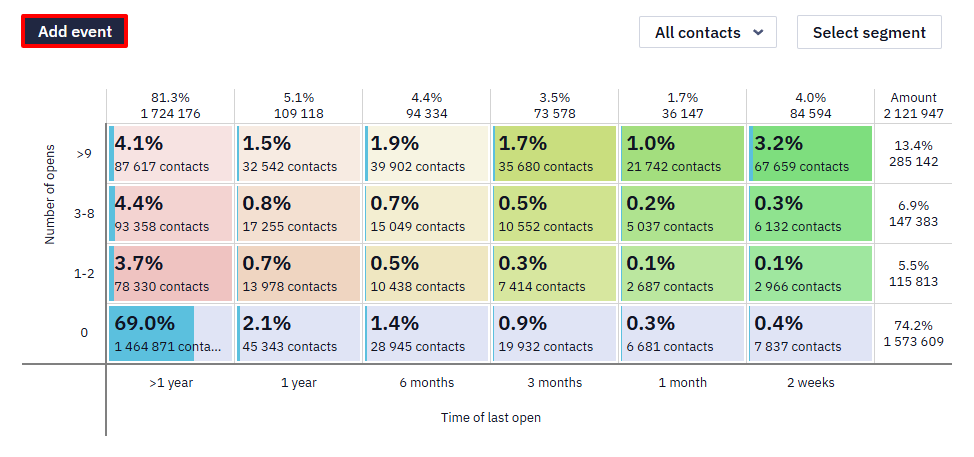
Add event
- Click the Add event button:
- Select the segments and event type.
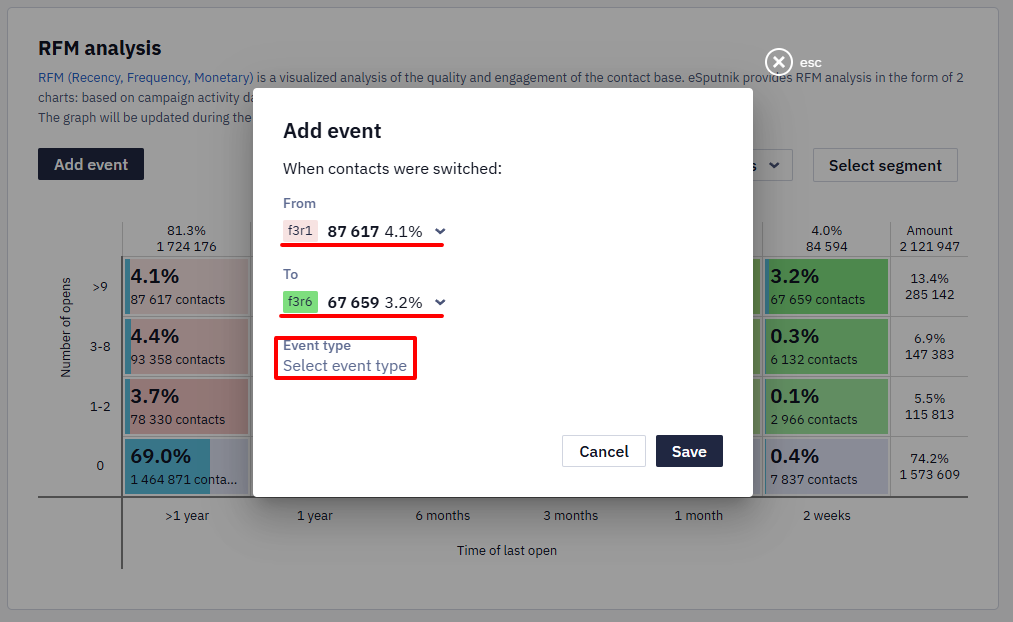
- Click the Save button.
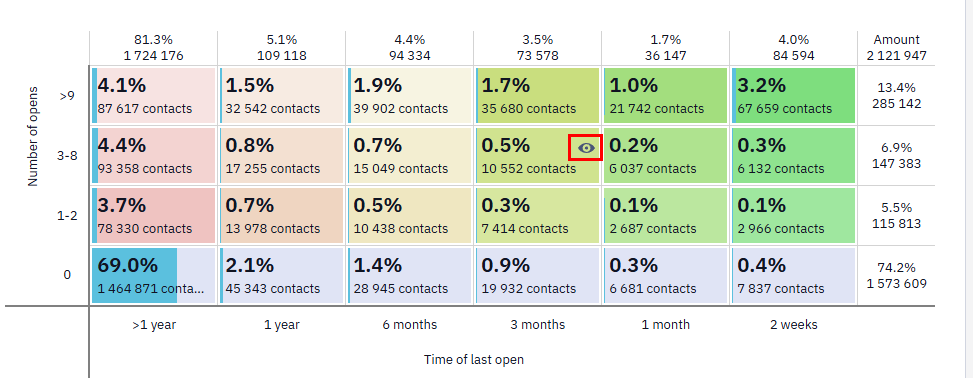
The cell, transition from which triggers an event, is indicated by an eye icon.
More details about RFM analysis >
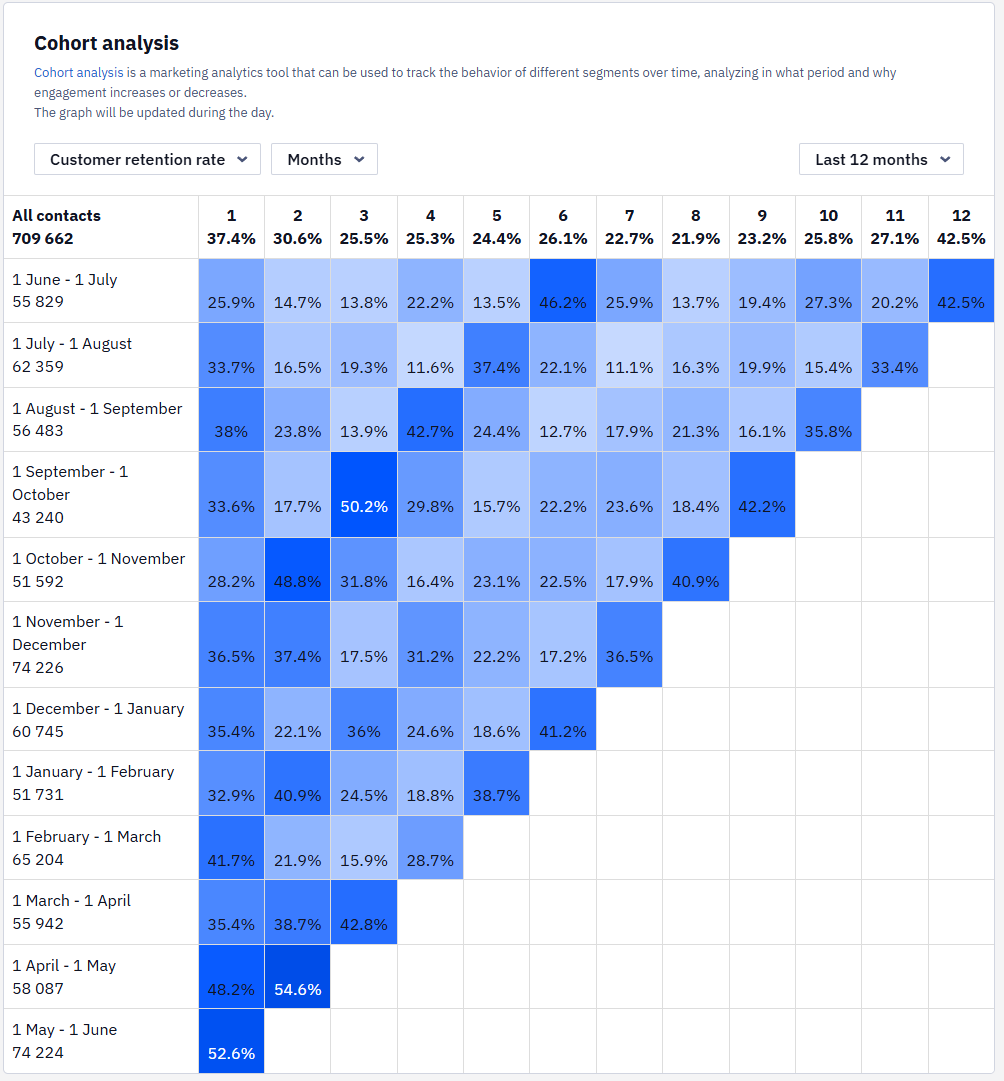
Cohort Analysis
The cohort analysis table shows contact data for different periods depending on contact activity. By default, the table uses Customer retention rate cohort type. Cohort sizes can be defined by month and in different periods.
Updated about 1 month ago