
Home Page Performance Dashboard
The Home page offers a comprehensive view of your marketing campaigns, providing key metrics to help you optimize user engagement, conversion rates, and campaign effectiveness. It delivers actionable insights to support data-driven decision-making.
Overall, the dashboard enables you to understand how your campaigns are performing globally and within each specific channel and type, so you can fine-tune your approach to maximize results.
Key Sections
The dashboard consists of four key sections:
1. Performance Summary
Provides a high-level snapshot of campaign activity across all channels and campaign types. Use this section to:
- Quickly identify engagement and conversion trends.
- Evaluate total campaign reach and performance.
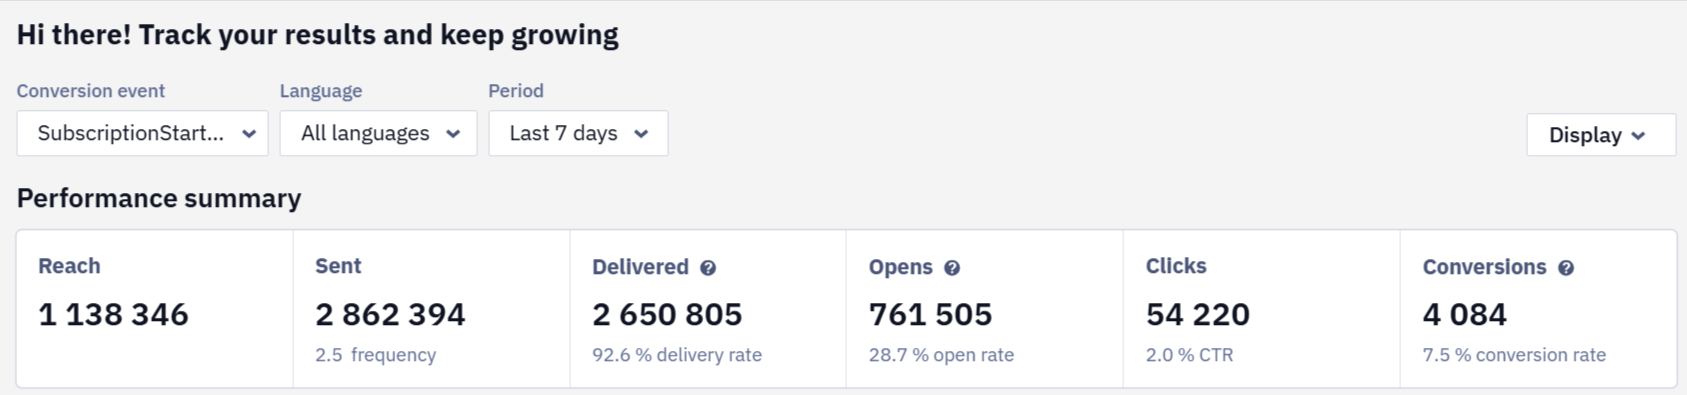
Performance Summary
2. Performance by Channel
Delivers detailed statistics for each communication channel (e.g., Email, App Inbox, Web Push), as well as total channel performance.
- See channel-specific performance breakdowns.
- Fine-tune strategies per channel based on actual performance.
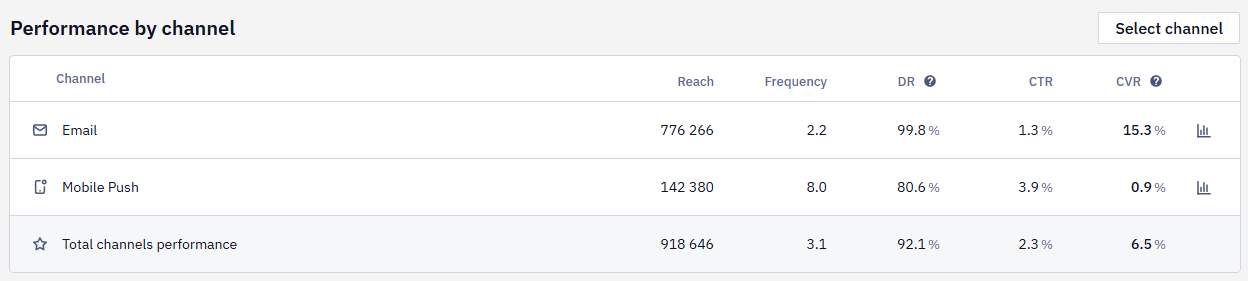
Performance by Channel
NoteThe Home page displays the performance of the channels selected in the Set up channels step of the Get started section of your account.
3. Top Performing Workflows
This section allows you to:
- See total workflows performance.
- Pinpoint automated sequences that drive the most value.
- Identify opportunities to scale or replicate top performers.
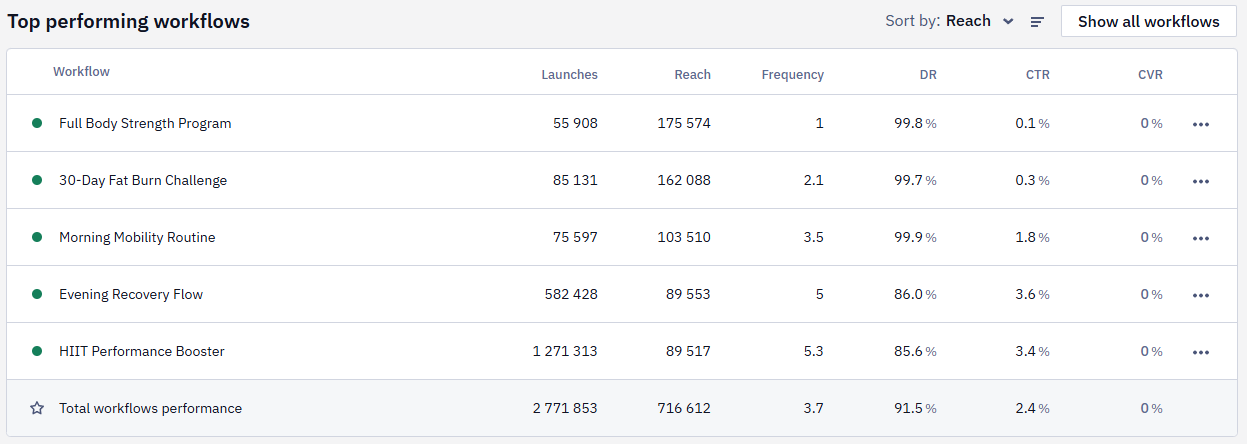
Top Performing Workflows
4. Top Performing Broadcasts
This section will help you to:
- Monitor total broadcast performance.
- Understand which content resonates best with your audience.
- Improve strategies for creating future newsletters.
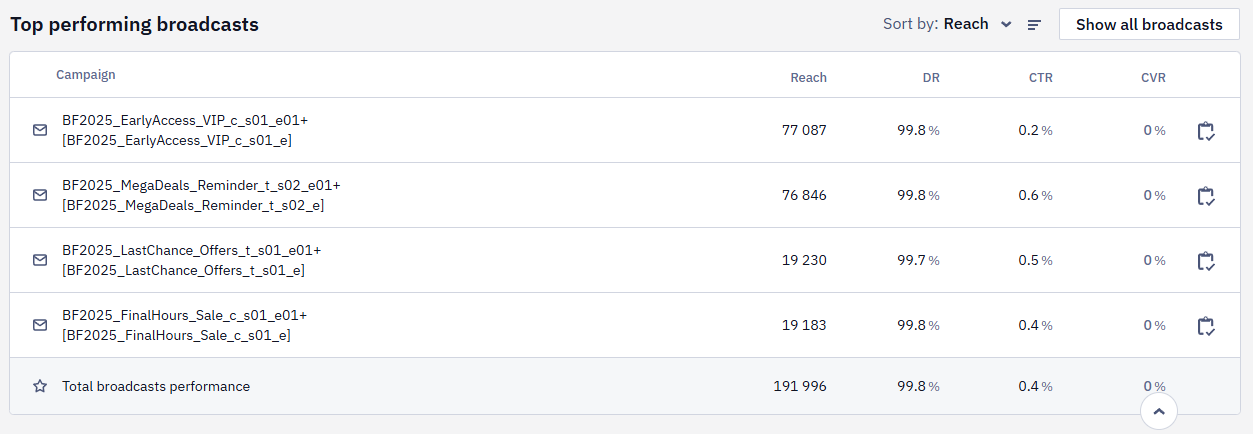
Top Performing Broadcasts
Key Metrics
Here are the key metrics displayed
- during the selected period,
- for the selected conversion event.
| General | Channels | Workflows | Broadcasts | |
|---|---|---|---|---|
| Reach | Unique contacts with SENT status | Unique contacts with SENT status per channel | Unique contacts for whom each workflow was launched | Unique contacts with SENT status for each broadcast |
| Sent | Total number of messages sent | Total sends per channel | Total messages sent across all workflow blocks | — |
| Frequency | Sent ÷ Reach | Sent ÷ Reach per channel | Sent ÷ Reach per workflow | — |
| Delivery | Total deliveries across all messages | Total deliveries per channel | Total deliveries within each workflow | Total deliveries per broadcast |
| DR | (Delivered ÷ Sent) × 100% | (Delivered ÷ Sent) × 100% per channel | (Delivered ÷ Sent) × 100% per workflow | (Deliveries ÷ Sent) × 100% per broadcast |
| Opens | Total number of opens across all messages | Total number of opens within each channel (except SMS) | Total number of opens recorded within each workflow (except SMS) | Total number of unique opens for each campaign (except SMS) |
| OR | (Opens ÷ Delivered) × 100% | (Opens ÷ Delivered) × 100% within each channel (except SMS) | (Opens ÷ Delivered) × 100% within each workflow (except SMS) | (Unique Opens ÷ Delivered) × 100% for each campaign (except SMS) |
| Clicks | Total clicks across all messages | Total clicks per channel | Total clicks generated within each workflow | Total unique clicks per broadcast |
| CTR | (Clicks ÷ Delivered) × 100% | (Clicks ÷Delivered) × 100% per channel | (Clicks ÷ Delivered) × 100% per workflow | (Unique Clicks ÷ Delivered) × 100% per broadcast |
| Conversions | Total conversions per all messages | Conversions per channel | Conversions generated within each workflow | Conversions generated per broadcast |
| CVR | (Conversions ÷ Clicks) × 100% | (Conversions ÷ Clicks) × 100% per channel | (Conversions ÷ Clicks) × 100% per workflow | (Conversions ÷ Unique Clicks) × 100% per broadcast |
| Launches | — | — | Number of times each workflow was launched (excluding test launches) | — |
Note
- In-Apps and Web Widgets are counted by Views instead of Sent and Delivered due to the specifics of their functionality.
- Some delivery confirmations may take up to 72 hours; such deliveries are counted on the day the relevant messages are sent
- For Mobile Push + In-App bundle messages, the click event is not tracked on the Mobile Push side — clicks are attributed to the In-App.
Managing Data Display
1. General Settings
- Conversion Event: Choose the specific action or goal (e.g., sign-up, purchase) you are tracking as a conversion.
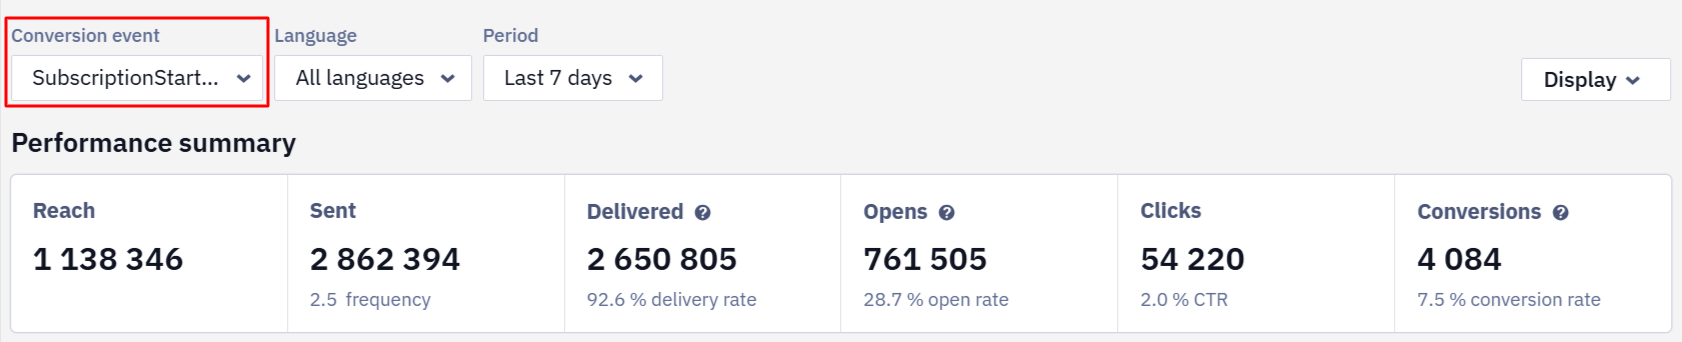
Conversion Event
Setting up conversion tracking >
- Language (for accounts with multilanguage): filtering by language versions of messages.
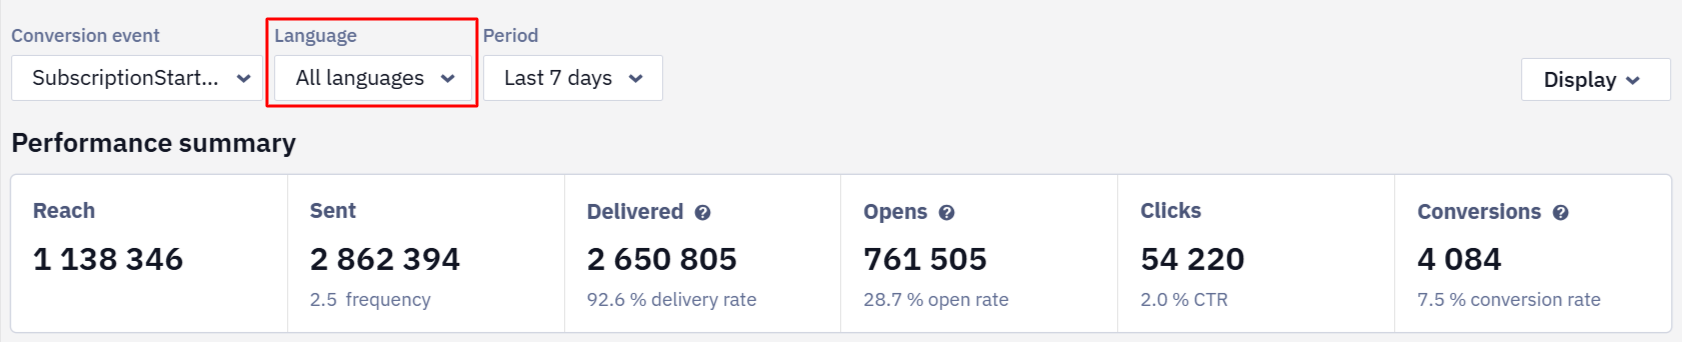
Language
- Period: Define the time range (e.g., current or previous week) for analyzing your campaign data.
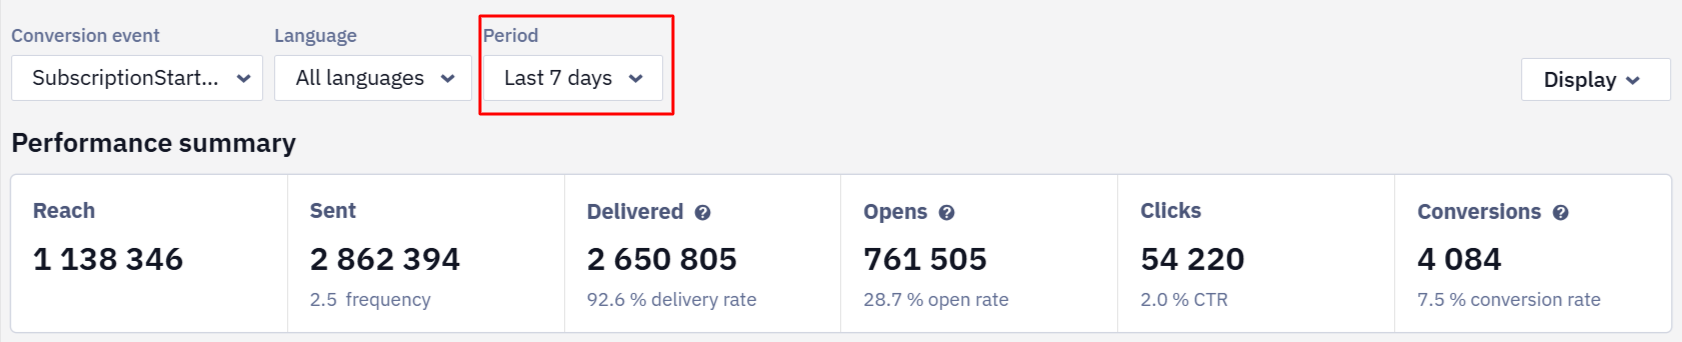
Period
- Show as: Choose whether to display the data as raw numbers (Absolute) or as percentages (Rates).
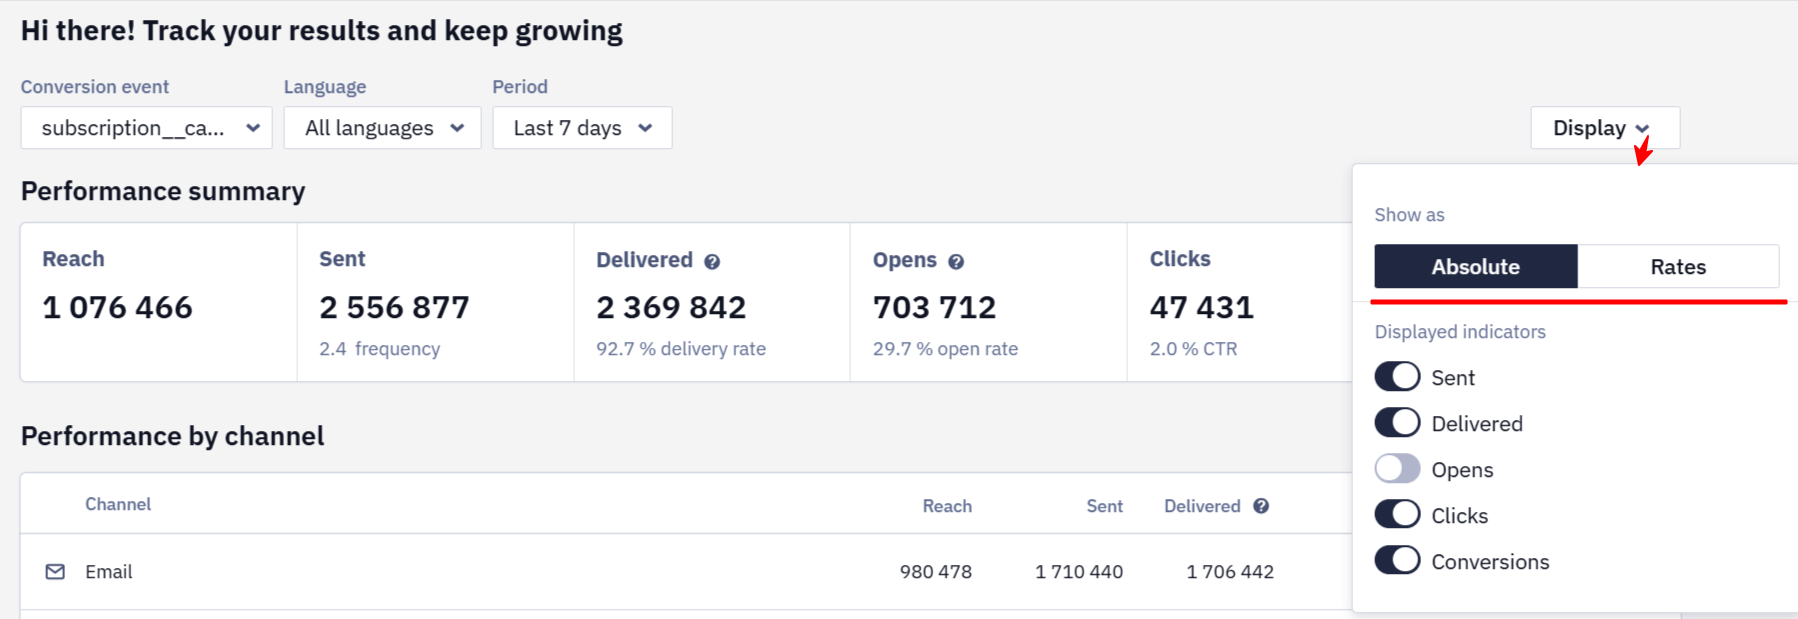
Display
2. Channels
- Select channel: Choose the communication channel (e.g., Email, SMS, In-App) for which you want to view performance metrics.
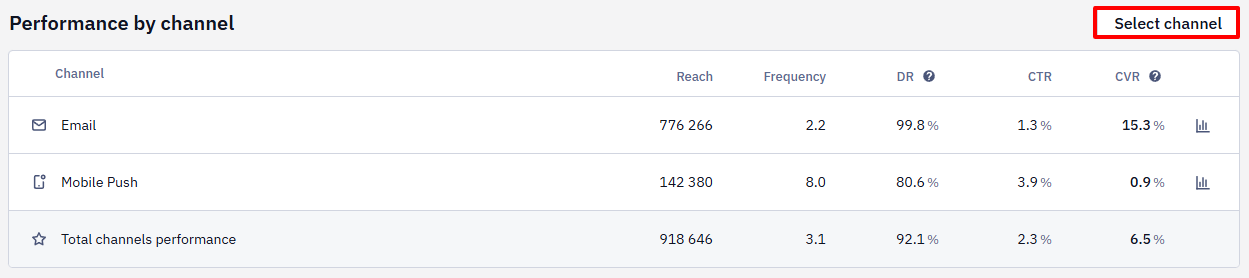
Select channel
- Show contacts analytics: Click on this icon leads to the overview of the contact activity for the corresponding channel.
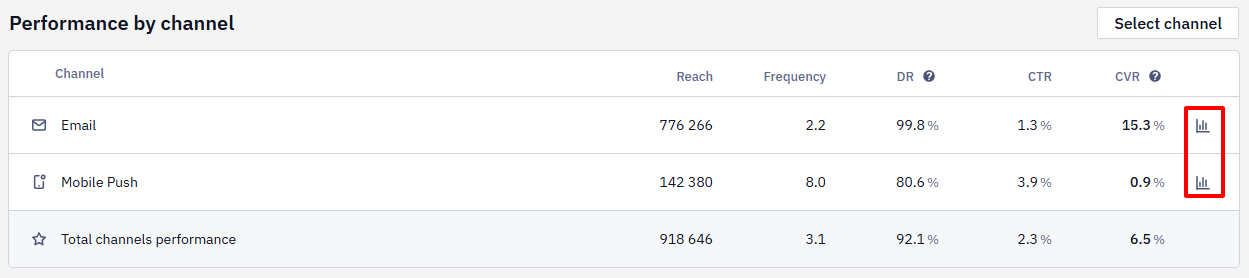
Show contacts analytics
NoteChannels are filtered by the Reach indicator.
3. Workflows
- Sort by: Filter by key metrics.
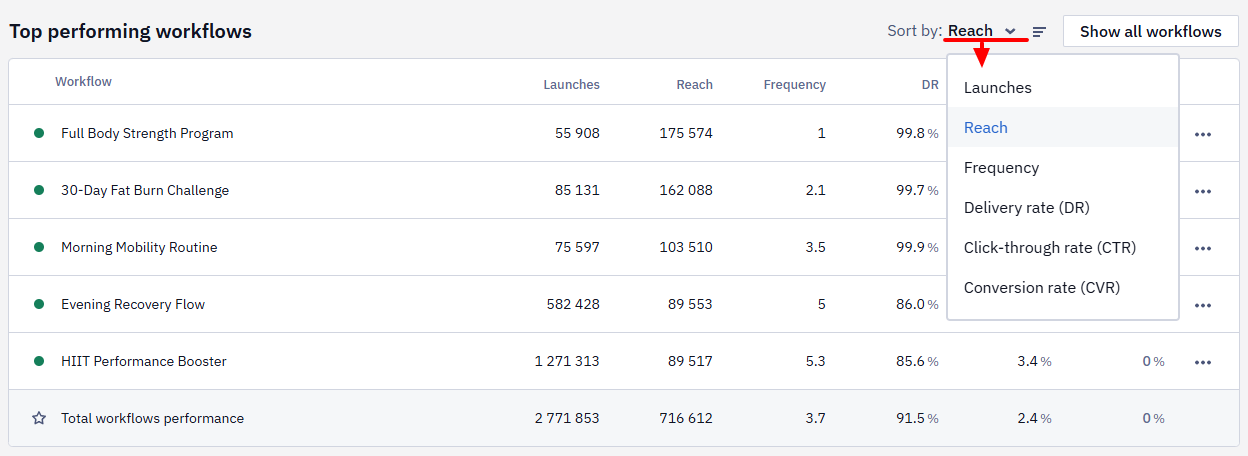
Sort by
- Show all workflows: Navigate to the main workflow list.
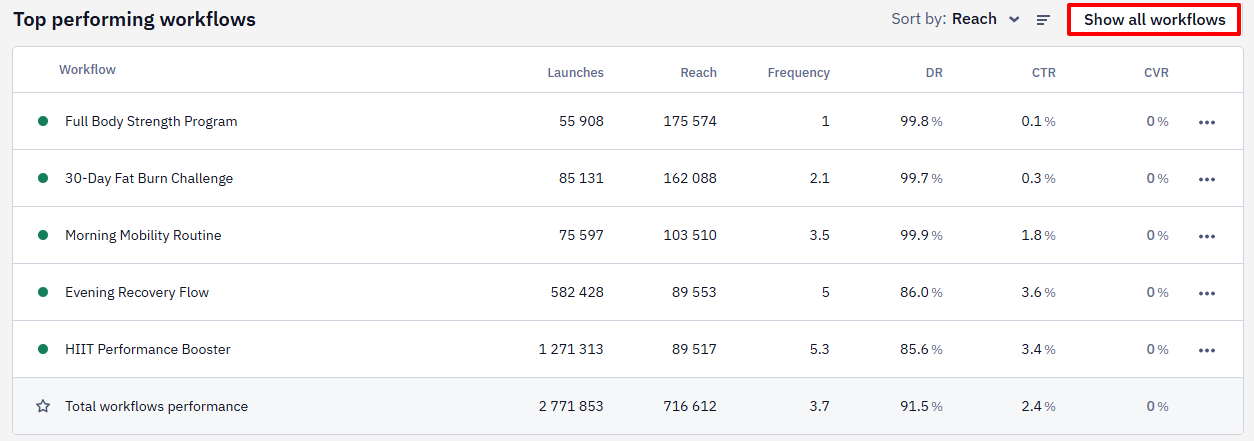
Show all workflows
- Actions: Clicking the three dots next to the workflow name reveals the following list of actions:
- Edit
- Show launch history
- Show campaign report
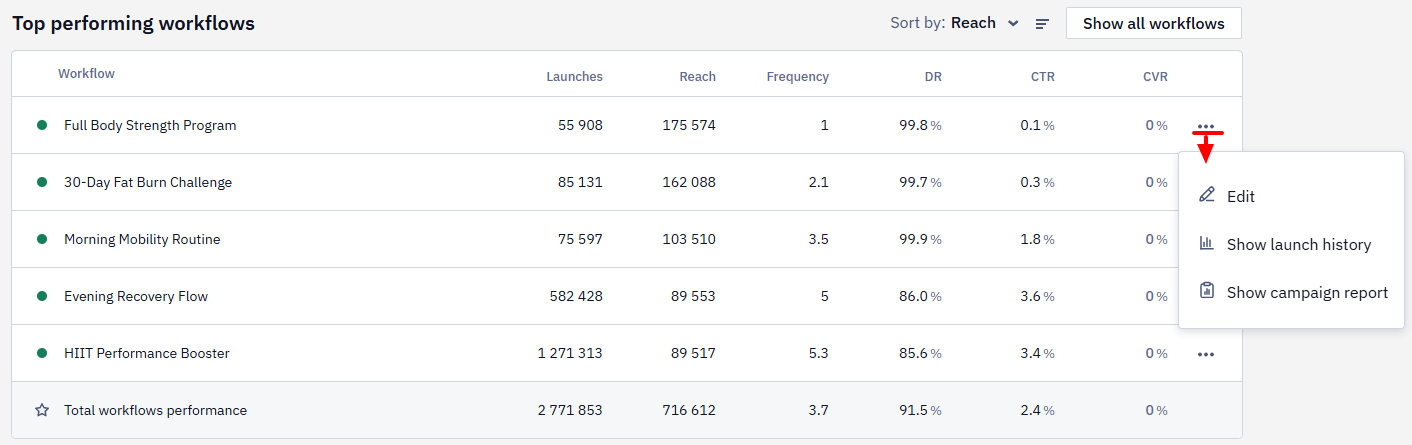
Actions
4. Broadcasts
- Sort by: Filter by key metrics.
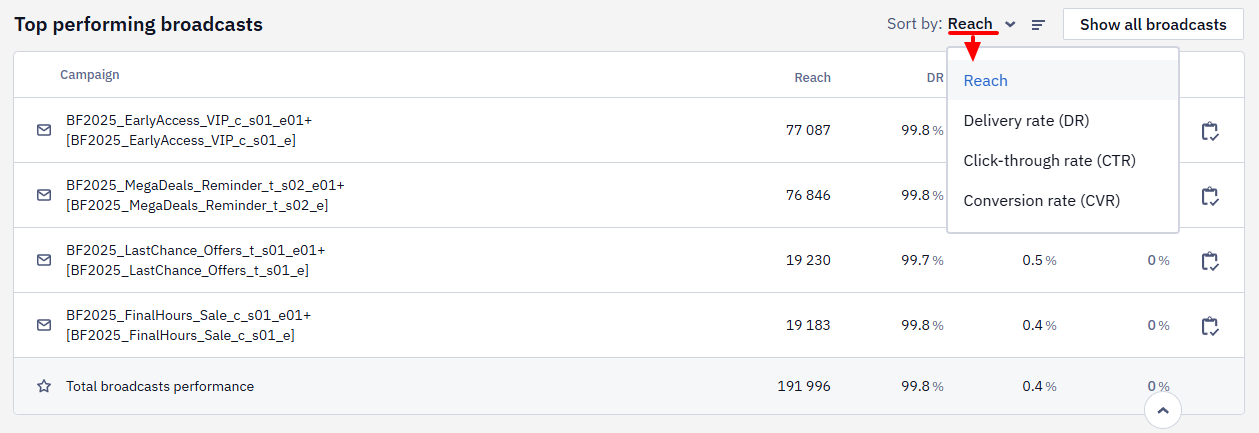
Sort by
- Show all broadcasts: Navigate to the main report list.
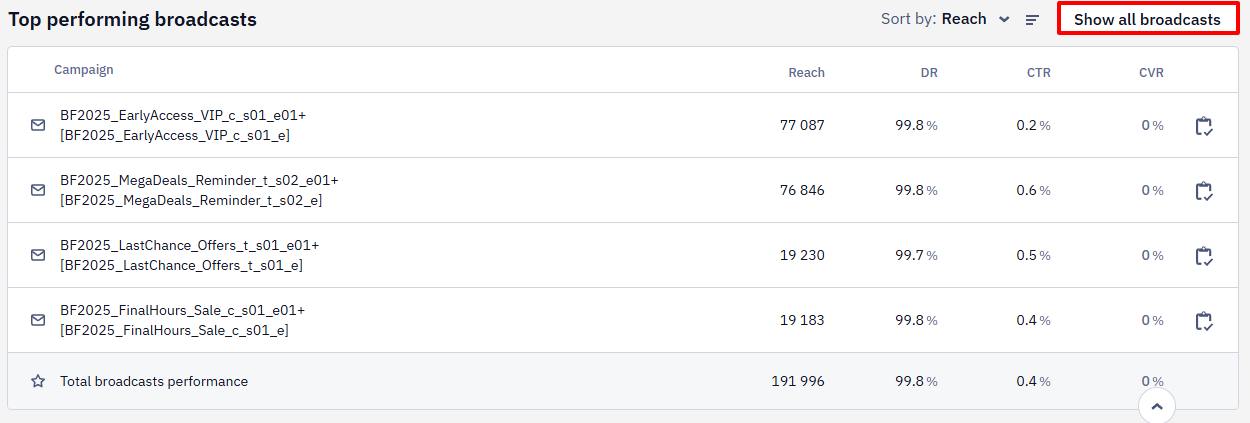
Show all broadcasts
- Show campaign report: Clicking the icon next to the broadcast name navigates to its report.
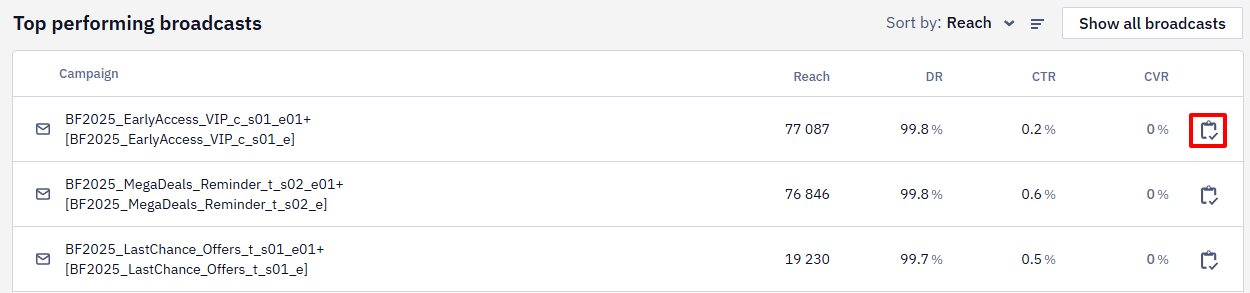
Show campaign report
To learn more on Reteno's analytics, please follow the links:
Updated 5 days ago