
Widget Report
Information about widgets is available in two sections:
- Reports (Campaigns → Reports): viewed and clicked statistics, activity dynamics, and conversions by identified users with Contact ID.
- Analytics (Site → Widgets): unique views, subscriptions, clicks, conversion, new contacts and activity dynamics by all widget interactions.
You can also check out general reports’ capabilities.
Reports
Conventionally, the report consists of 4 parts:
- General information.
- Performance indicators.
- Conversions.
- Detailed statistics.
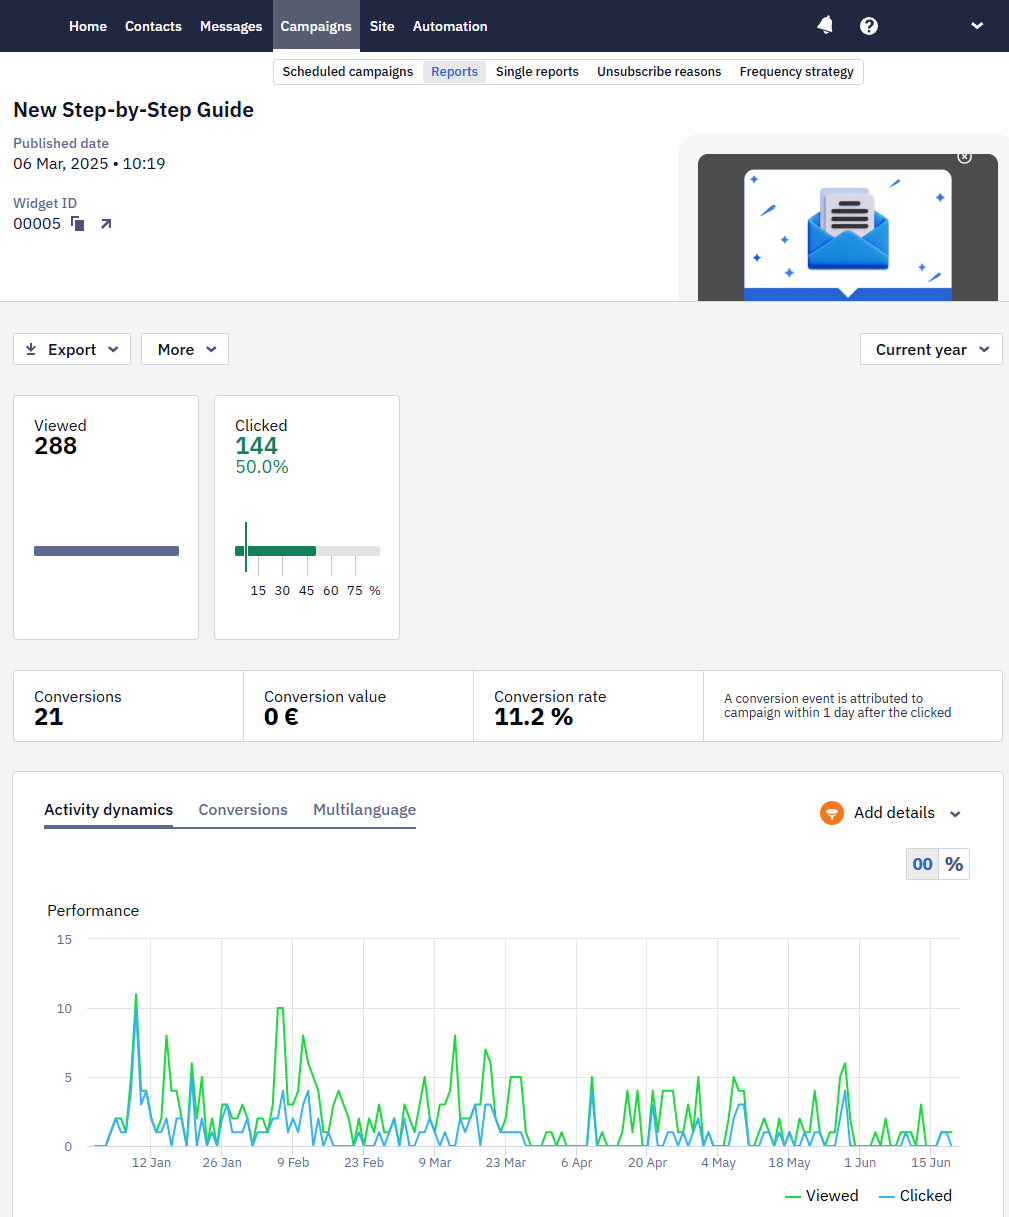
1. General Information
The first part of the report contains the following data:
- The widget’s name.
- Public date.
- Widget ID. To copy an ID, click on the copy icon next to it. Click on the link icon to edit a widget.
- Widget preview.
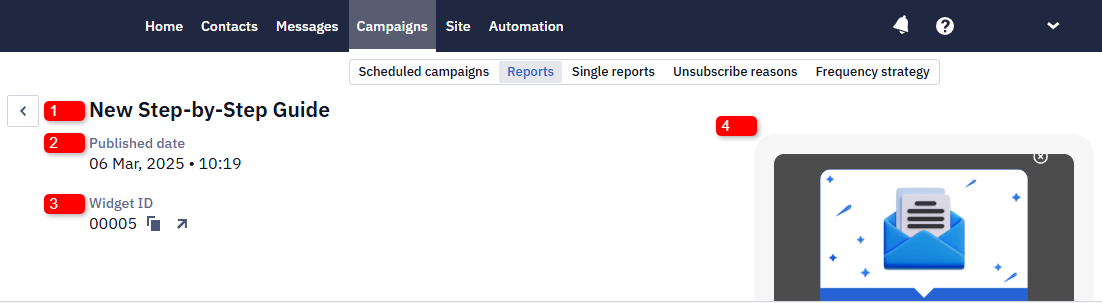
2. Performance Indicators
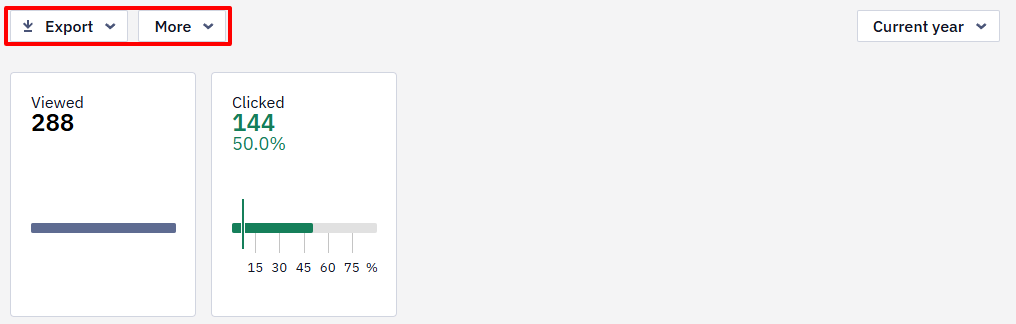
Reteno automatically tracks the performance of widgets, including views and clicks. Statistics are presented in a table.
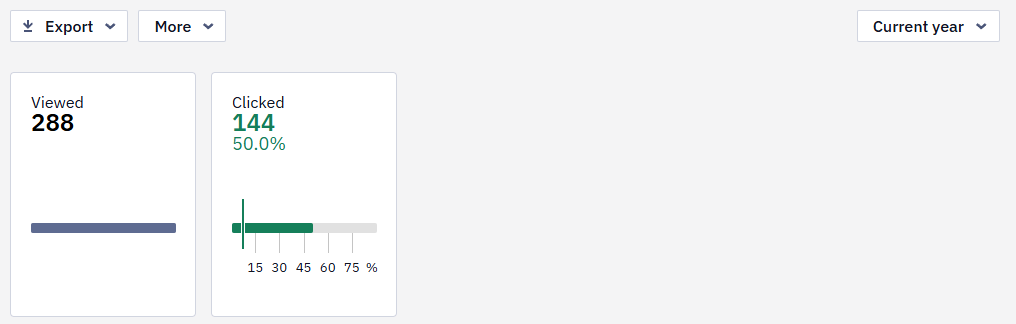
Green marks on the scale show the conditional indicators of a successful campaign, and red marks are negative indicators' conditional norm.
Clicking on any report item opens a window for viewing the contacts list.
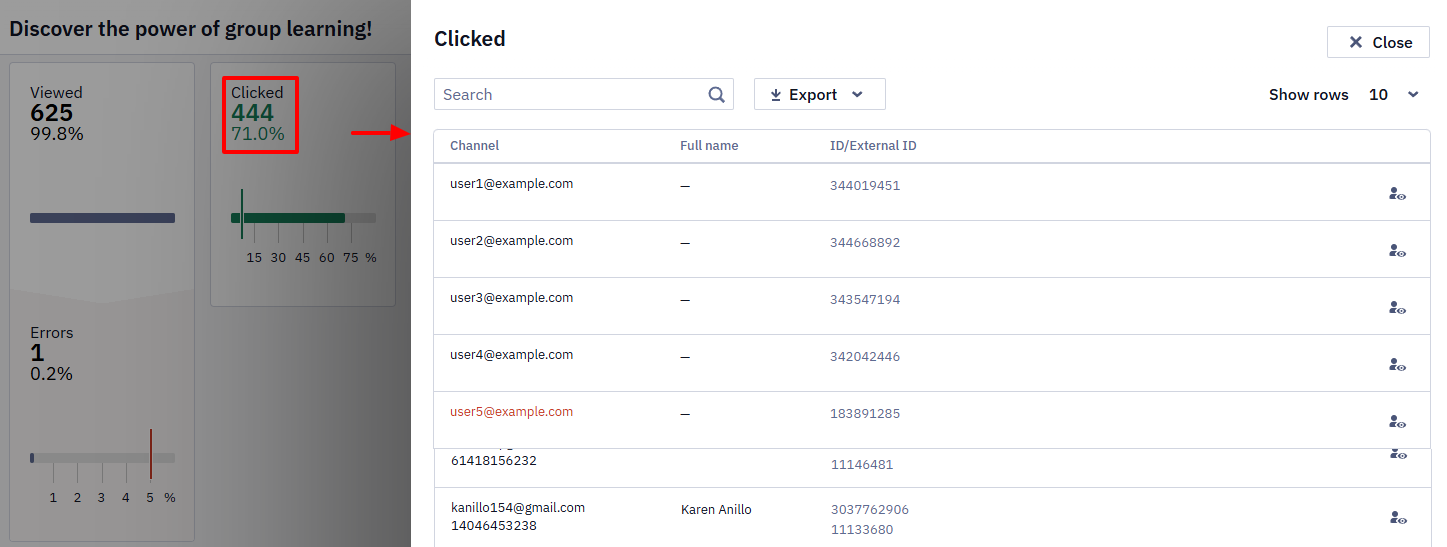
Above the general statistics are the following tabs:
- Export. Allows you to export contacts from the report to a CSV file, to an existing or a new list. Export is available for all campaign metrics: viewed and clicked.
- More. Allows you to delete the report.
3. Conversions
If you define user events as conversion events and set up their display, you will be able to evaluate the conversion results of the campaign.
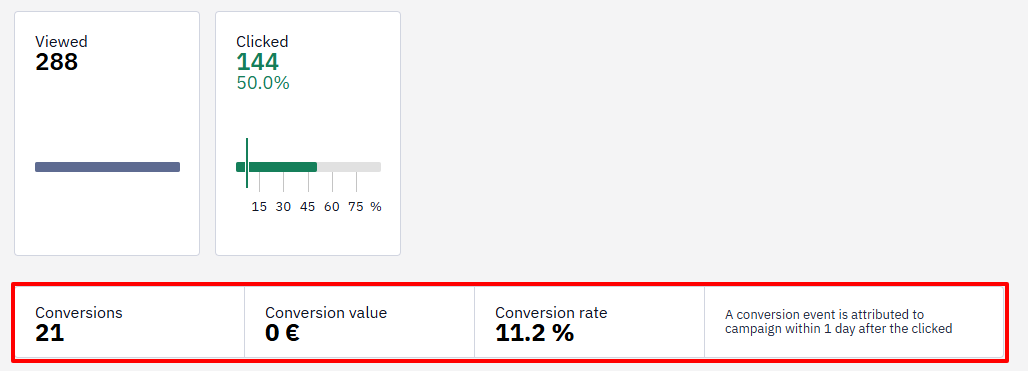
More on the settings for displaying conversion >
4. Detailed Statistics
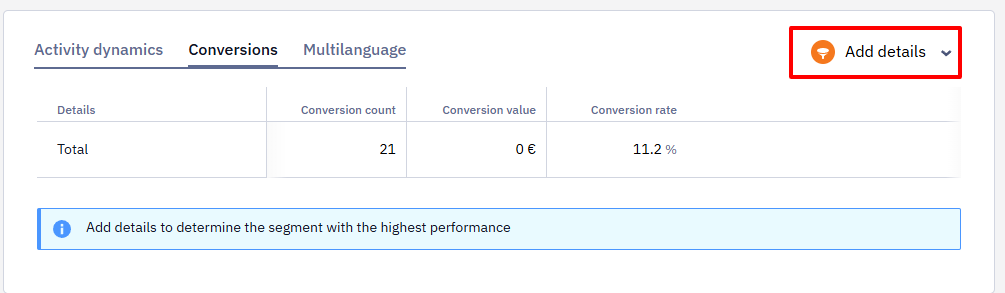
Using the Add details option, you can filter the data from the Activity dynamics, Conversions and Multilanguage (optional) tabs by segments or language versions of the widget.
Multilanguage (optional)
Multilanguage is an automation tool that enables sending messages in different languages within one campaign. It helps avoid long message lists and voluminous unsystematic reports for every message.
Reports on multilingual campaigns are described in a special article.
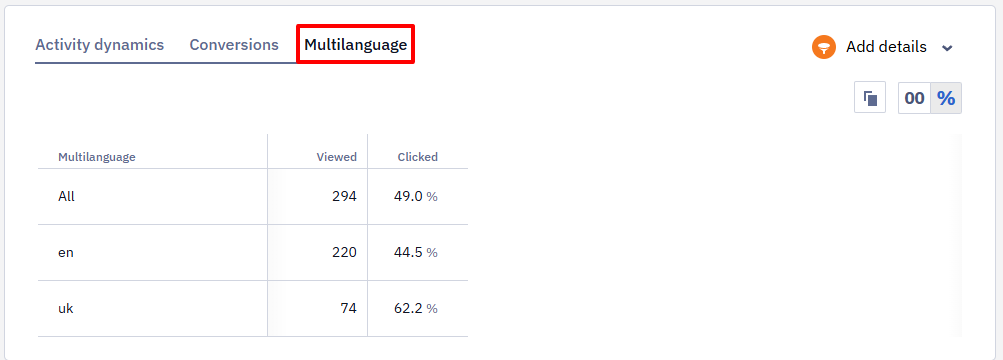
Learn more about multilingual campaign report >
Statistics are collected for the widget as a whole. A widget made of several pages, or one with a slider, has no breakdown by page or slide — a view or a click counts for the widget, wherever in it the visitor was.
Analytics
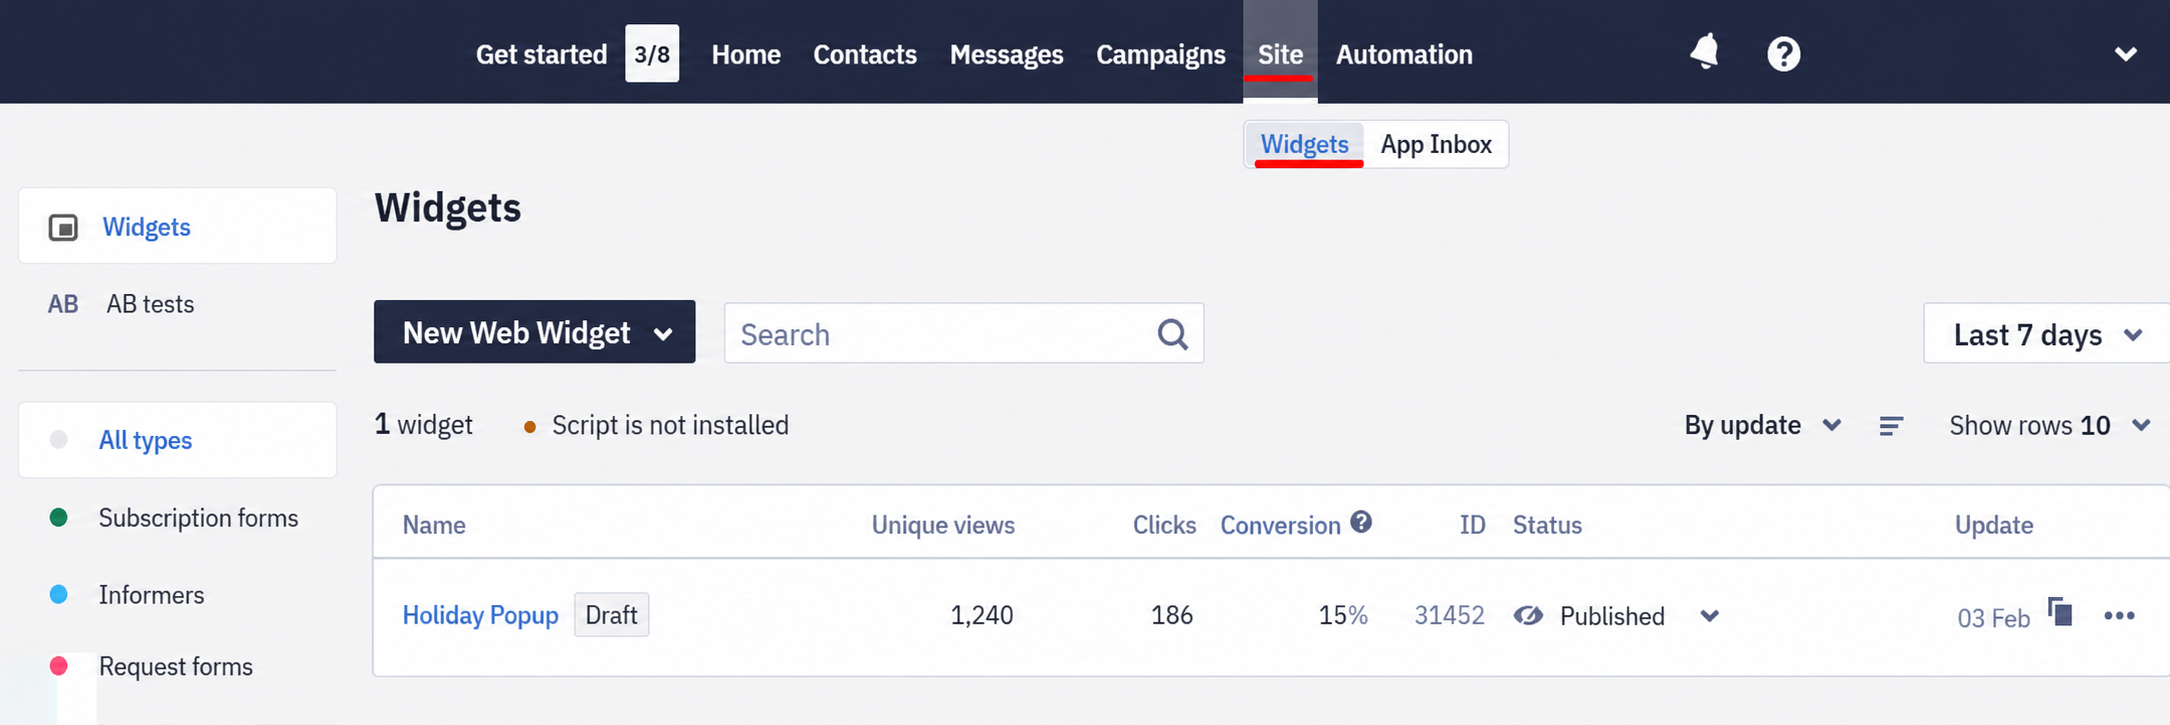
To see the widget interaction statistics, go to the Site → Widgets section, select the tab with the widget type and click on its name.
Analytics Parameters
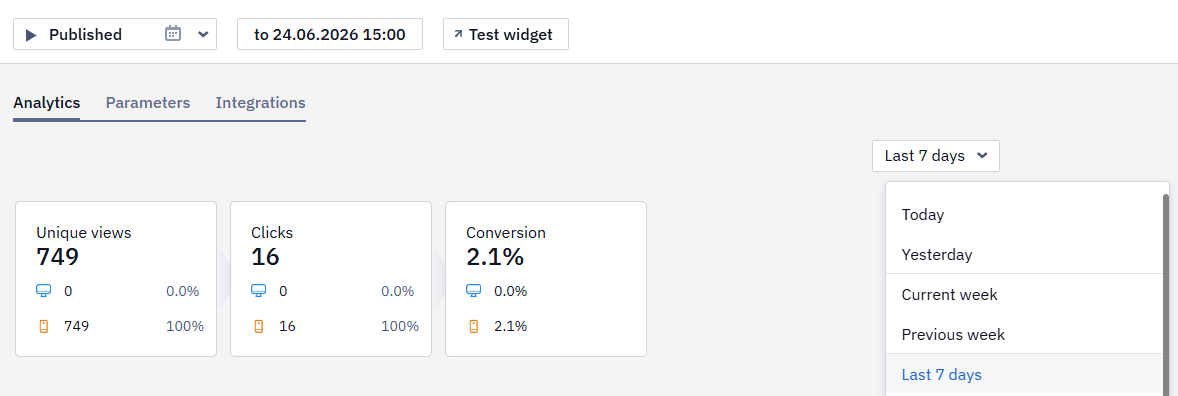
The upper part of the report presents the generalized statistics of the widget for the selected period:
-
Unique views
-
Subscriptions (for subscription forms)
-
Clicks (for all widget types except subscription forms)
-
Conversion:
- The ratio of views to subscriptions (for subscription forms)
- The ratio of views to clicks (for all widget types except subscription forms)
NoteWhen calculating conversion for Informers, the system counts:
- only clicks marked as target actions if at least one target action is configured;
- all tracked clicks if no target actions are configured.
- New contacts (for subscription forms)
Activity Dynamics
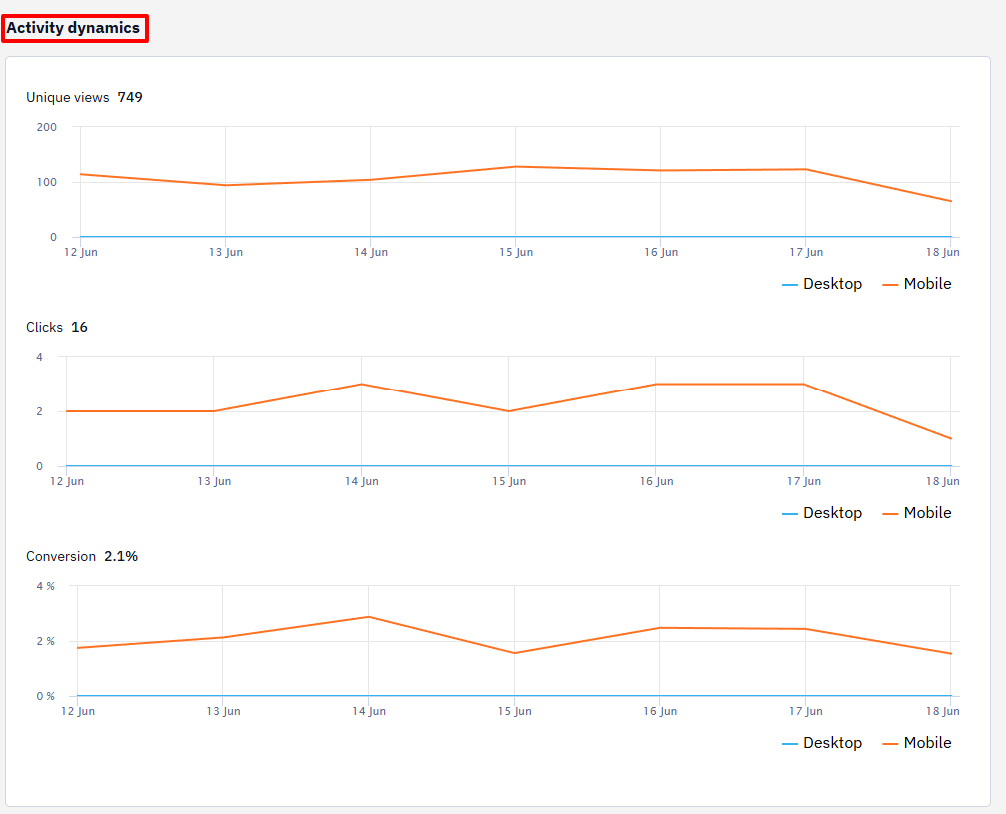
Below you can see site visitors’ activity dynamics in graphs to easily track the widget's effectiveness over a certain period.
Statistics are updated once per minute.
Updated about 1 month ago