
In-App Report
The report on the interaction with In-App messages displayed according to the triggering rules s presented in the Campaigns → Reports section.
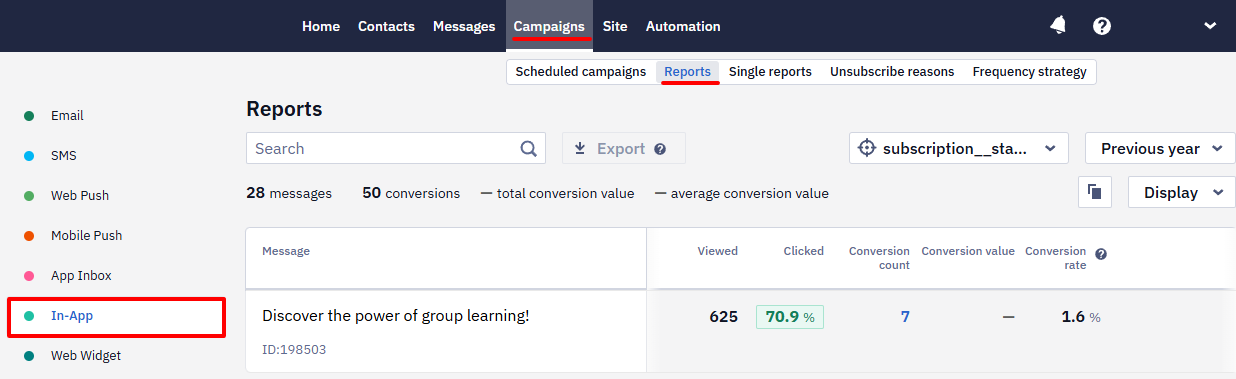
The report shows views, clicks, errors, and activity dynamics.
NoteSee general options for working with reports at the link >
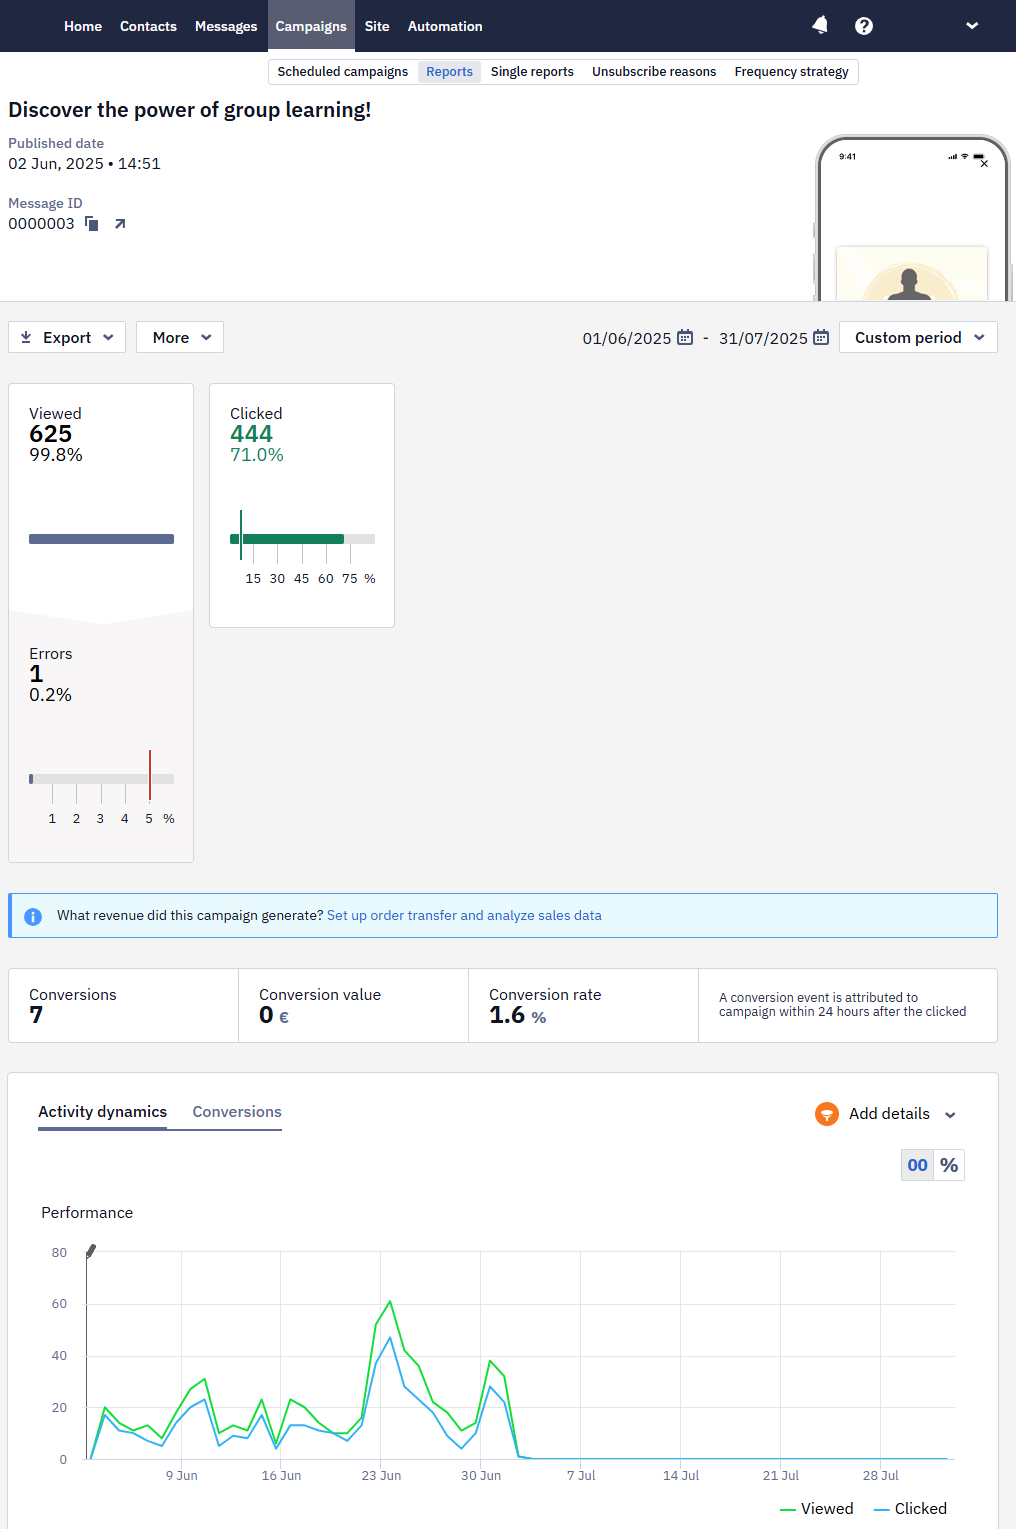
Conventionally, the report consists of 4 parts:
- General information.
- Performance indicators.
- Conversions.
- Detailed statistics.
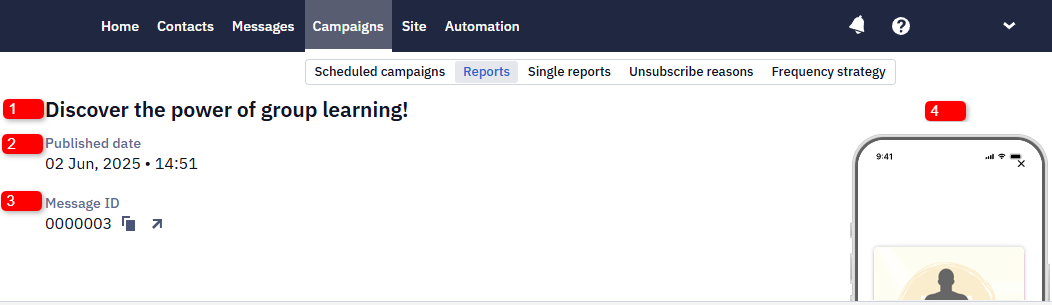
1. General Information
The first part of the report contains the following data:
- The In-App’s name.
- Published date.
- Message ID. To copy an ID, click on the copy icon next to it. Click on the link icon to edit an In-App.
- In-App preview (not displayed for HTML version).
2. Performance Indicators
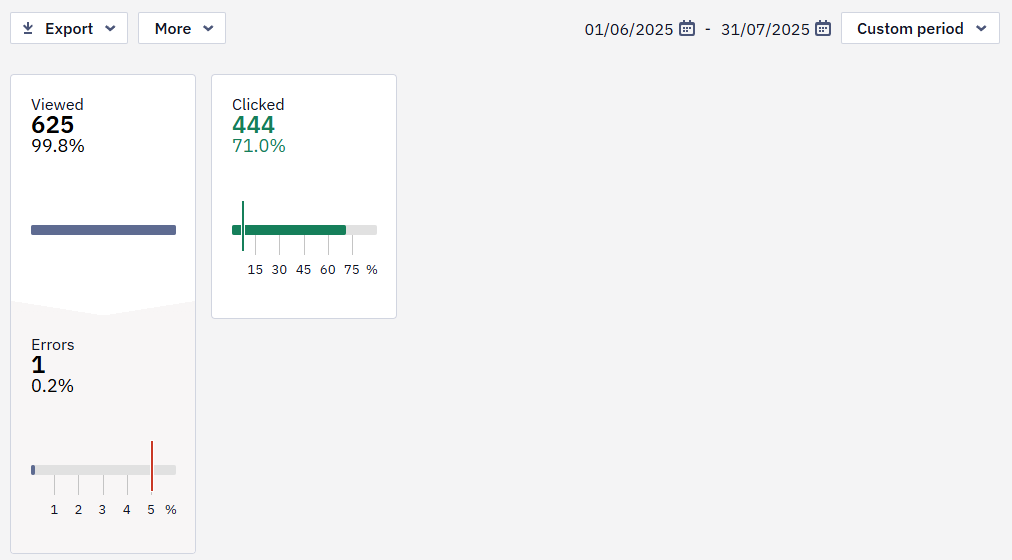
Reteno automatically tracks the performance of In-App messages, including views, clicks, and errors.
NoteFor Mobile Push + In-App bundle messages, clicks on the In-App aren't counted in the In-App report: they're counted as Mobile Push clicks.
Views of such an In-App aren't recorded either: they appear neither in this report nor in the contact's activity, which shows only In-Apps displayed by their own conditions.
The Clicked metric counts clicks on the message as a whole — the report doesn't break clicks down by individual button. To analyze buttons separately, give each button a distinct link or deep link, or pass custom data. To see which link was clicked, use the
clickEventLinkfield, which is available in webhooks, in the BigQuery export, and through the Get contact activity resource.
Green marks on the scale show the conditional indicators of a successful campaign, and red marks are negative indicators' conditional norm.
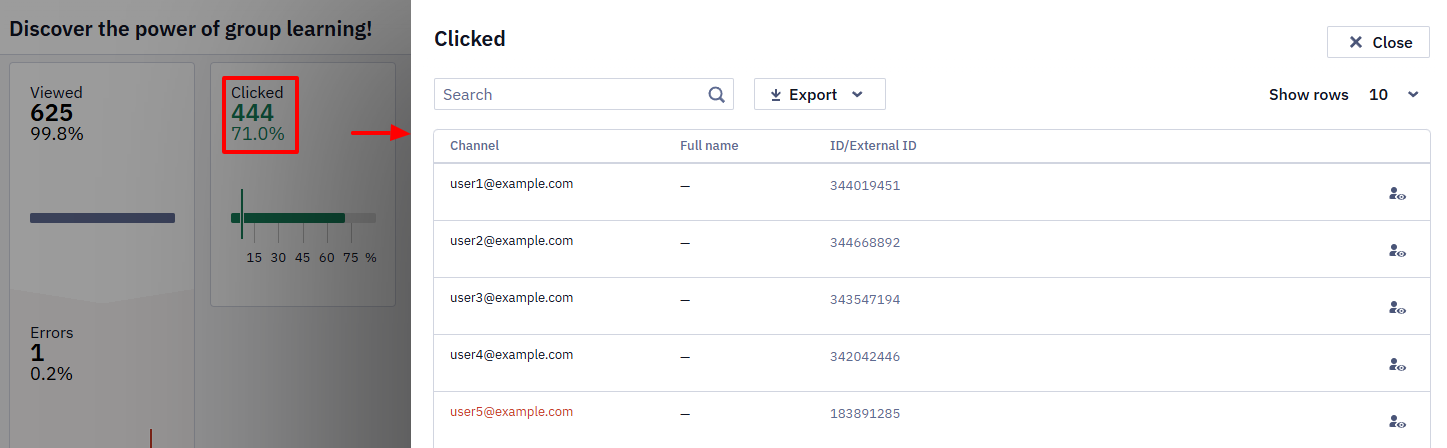
Clicking on any report item opens a window for viewing the contacts list.
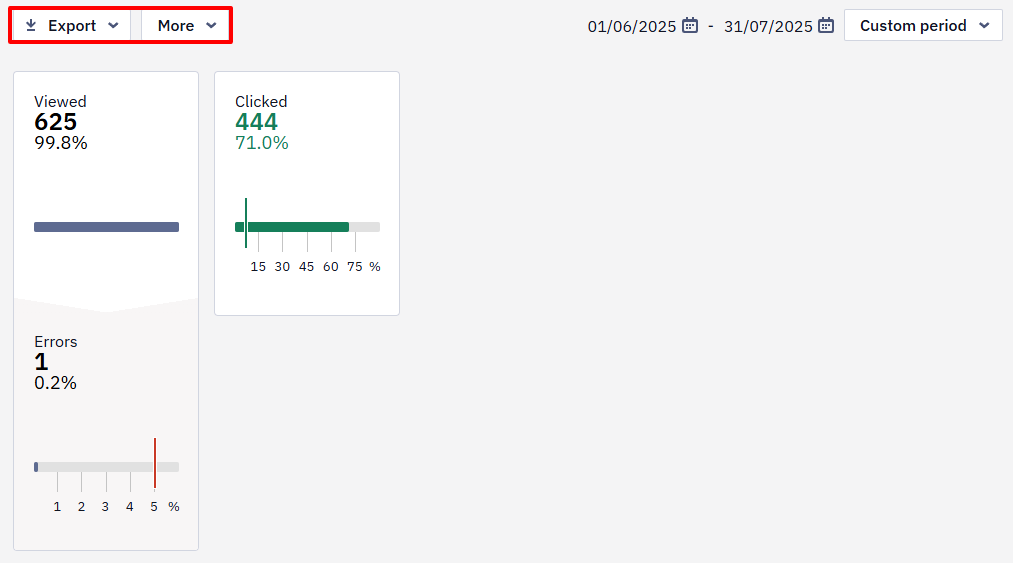
Above the general statistics are the following tabs:
- Export. Allows you to export contacts from the report to a
CSVfile or an existing/ new list. Export is available for all campaign metrics: viewed, clicked, and errors. - More. Allows you to delete the report.
3. Conversions
If you define user events as conversion events and set up their display, you will be able to evaluate the conversion results of the campaign.
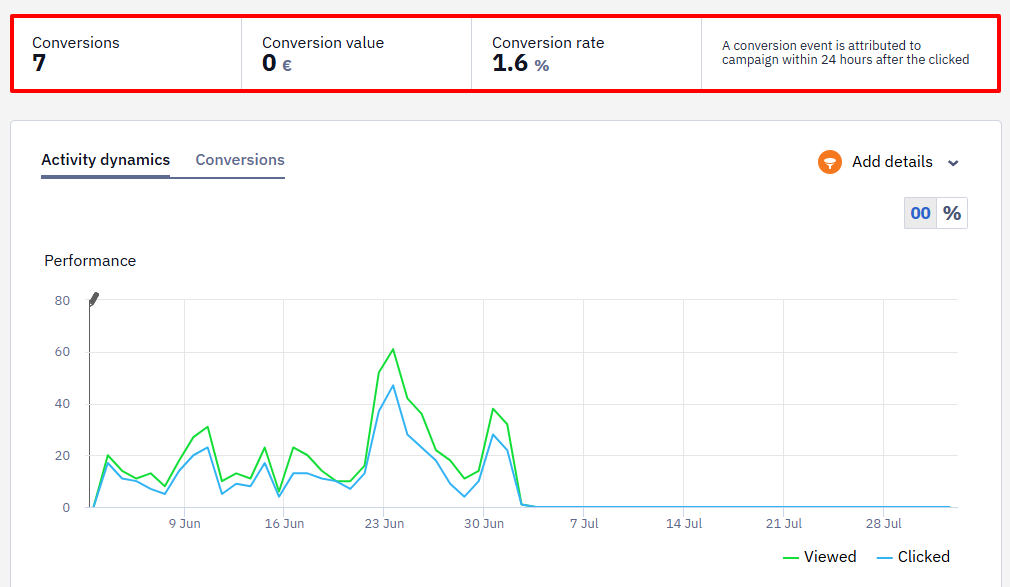
More on the settings for displaying conversion >
4. Detailed Statistics
The Activity dynamics tab displays the Performance graph, which shows views and clicks since the In-App publication.
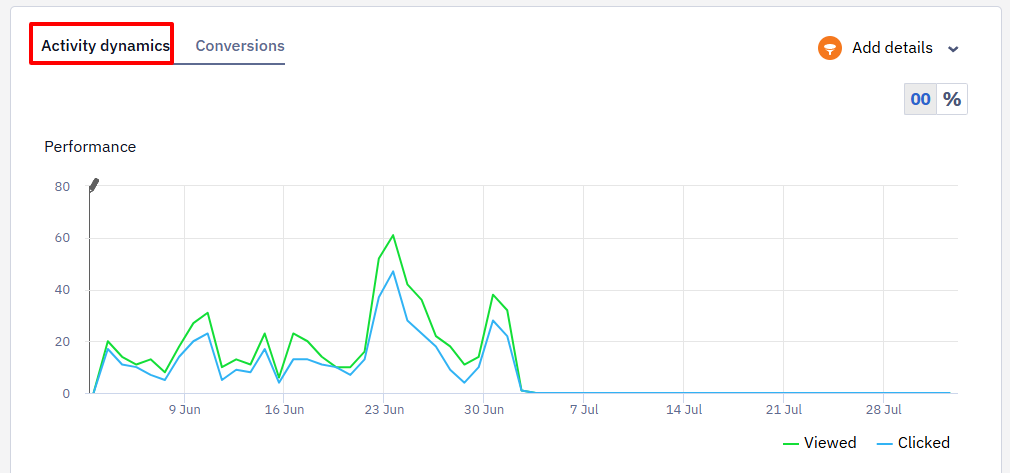
You can filter tabs’ data using the Add details option.
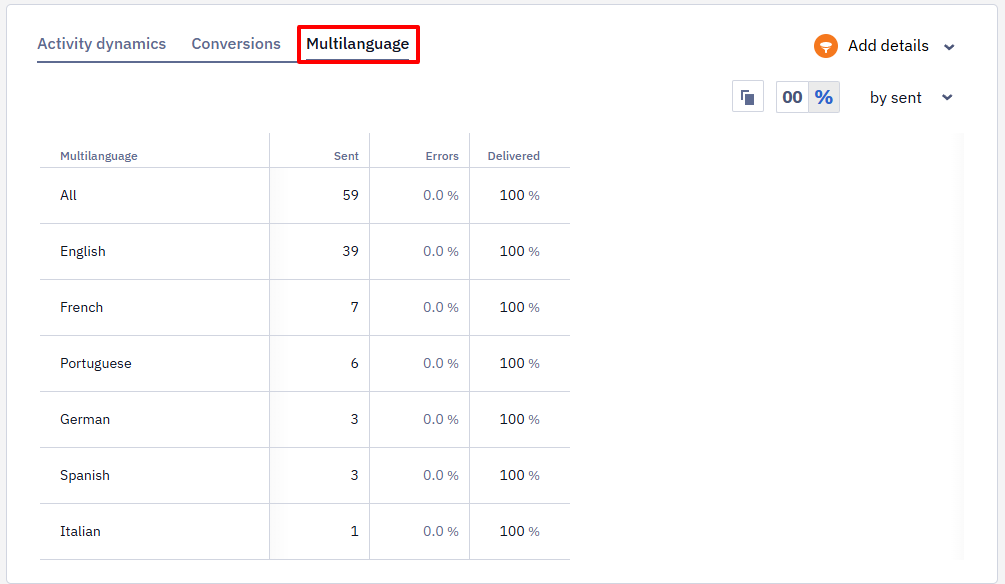
Multilanguage (optional)
Multilanguage is an automation tool that enables sending messages in different languages within one campaign. It helps avoid long message lists and voluminous unsystematic reports for every message.
Updated 25 days ago