
Tracking Campaign Performance in Google Analytics 4
Google Analytics 4 (GA4) is a new version of the Google Analytics platform that provides deeper and more complete tools for event analysis, unlike Google Universal Analytics, where the emphasis is on sessions. Event tracking allows you to collect data about user interactions with brands more flexibly and detailedly. Instructions for getting started with GA4 are available here .
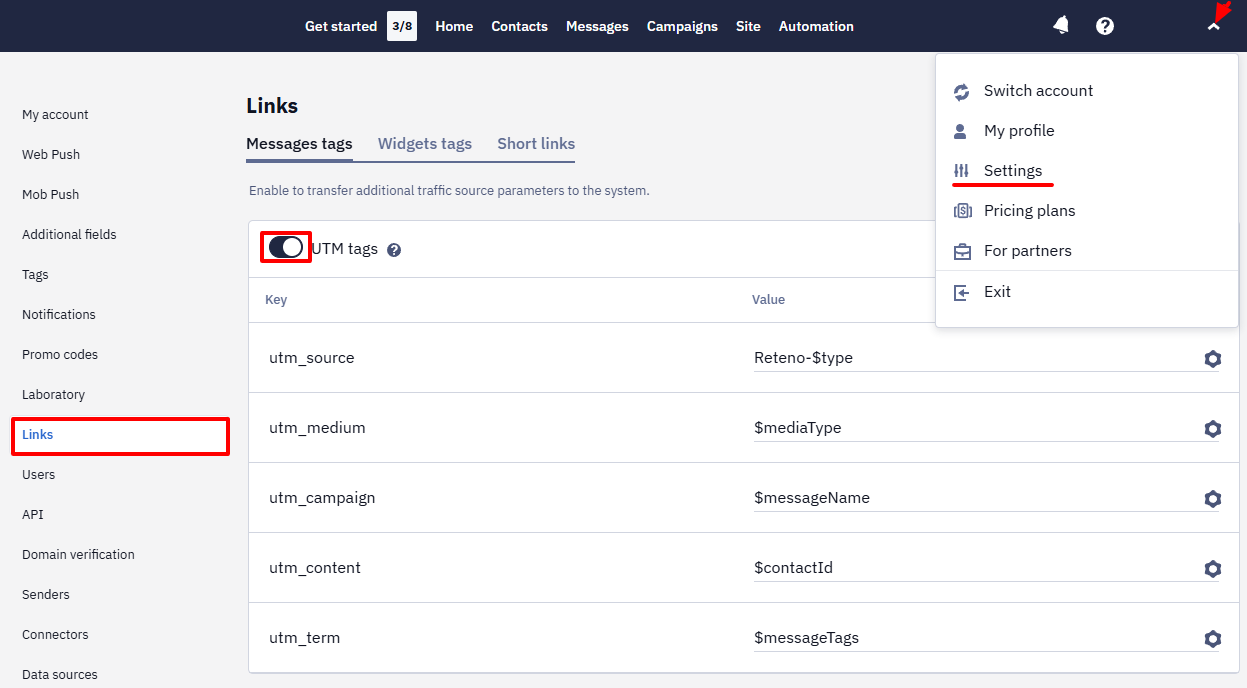
NoteCheck the settings for transferring UTM tags in your Reteno account: it must be activated. Learn more about UTM tags.
There is no need to additional configure Reteno integration with Google Analytics.
Channel Analysis
GA4 displays statistics by channels on
- Users,
- Sessions,
- Interactions,
- Events,
- Revenue (Revenue data is available if you configured sending e-commerce events from your website or mobile app in analytics).
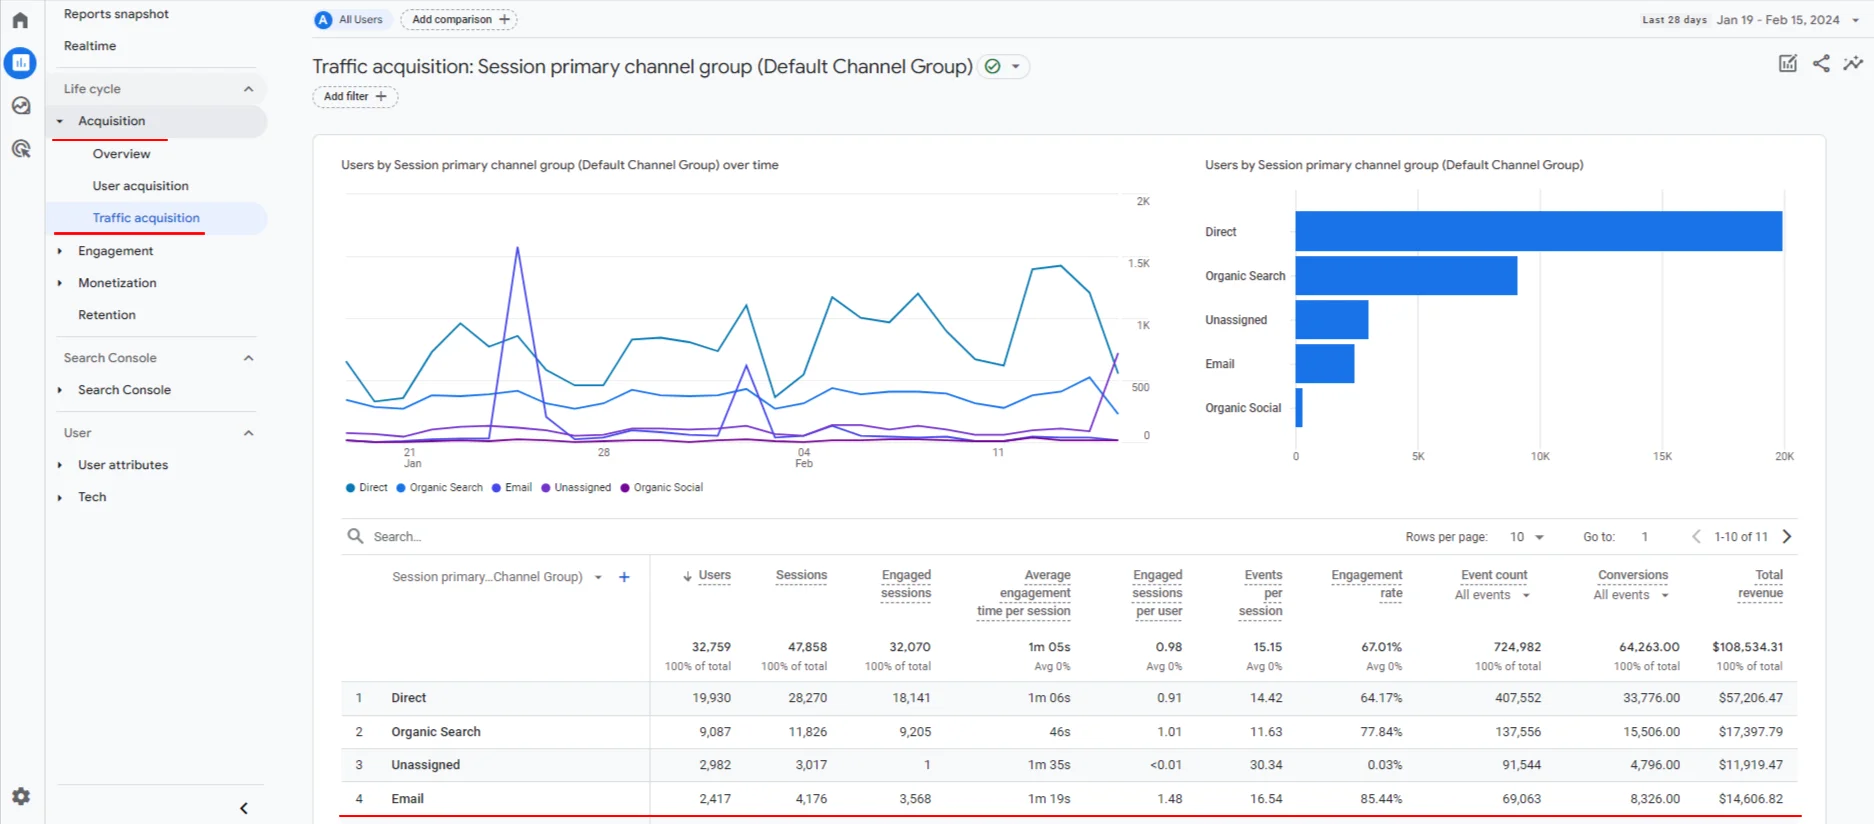
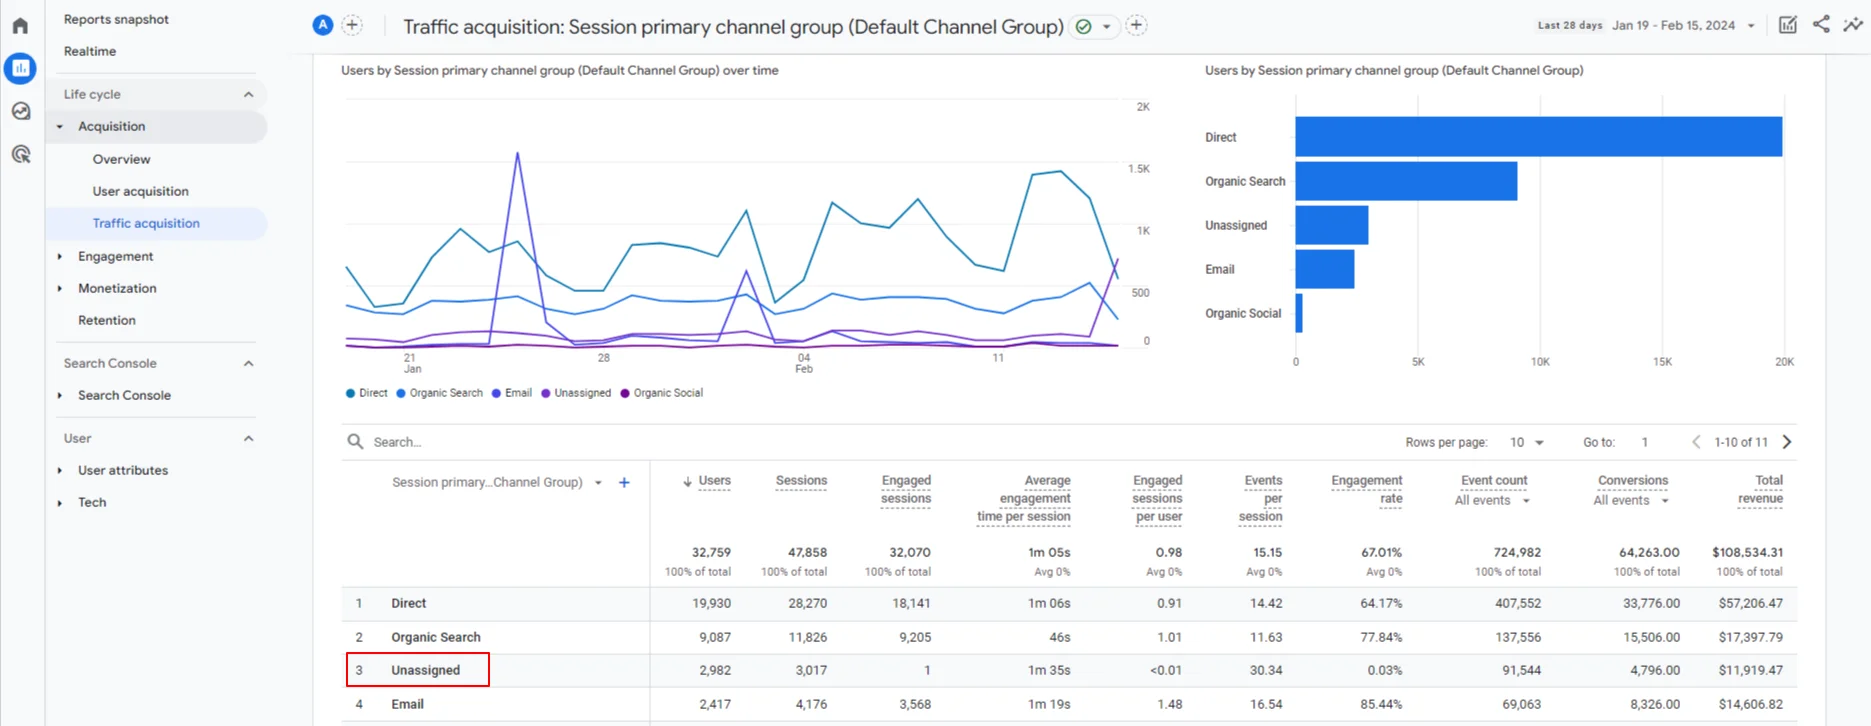
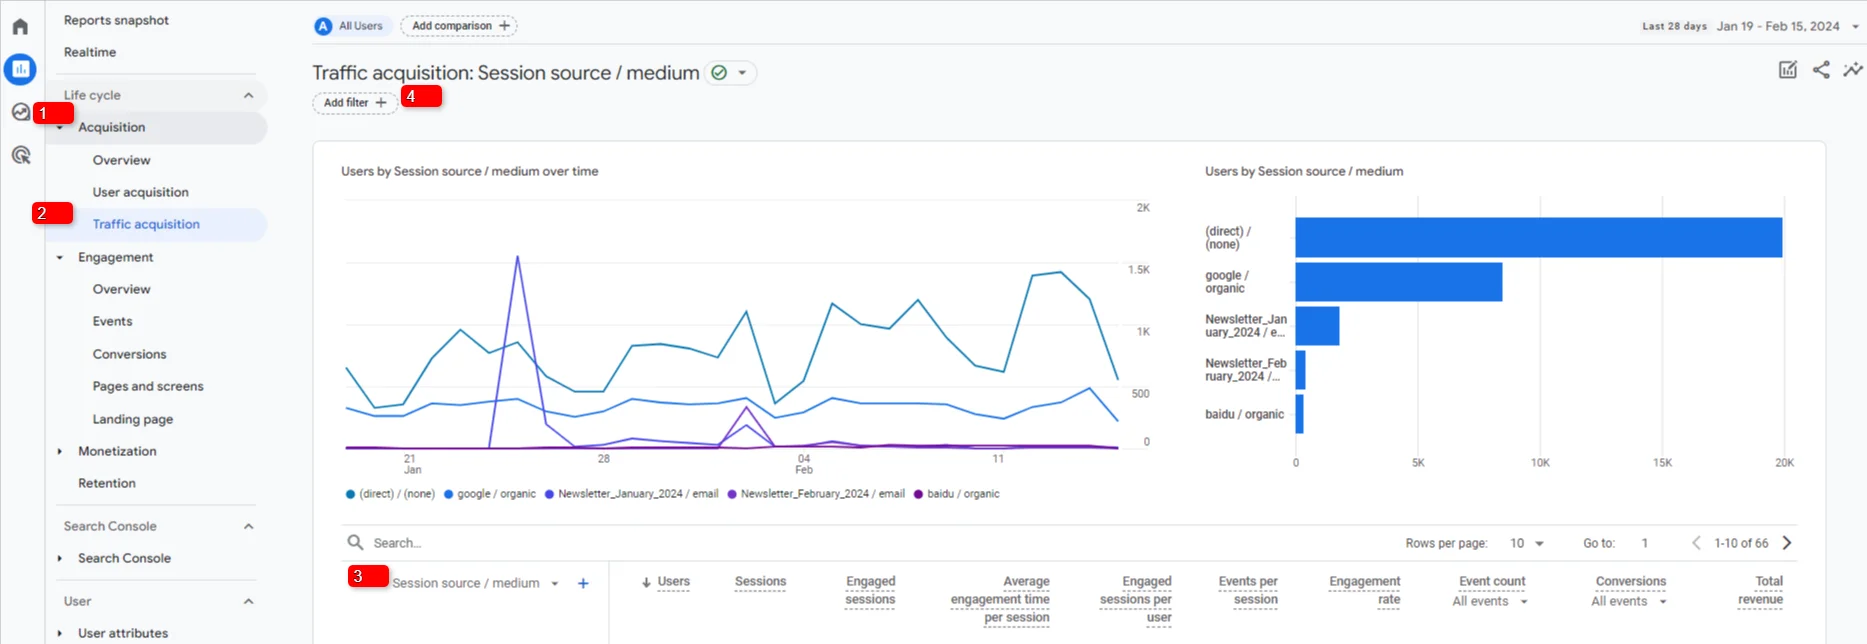
To check the collection and mapping of data to a channel, go to the Acquisition → Traffic acquisition → Session primary channel group section. The email channel report is included in analytics by default; setting up the display of other media channels is described below.
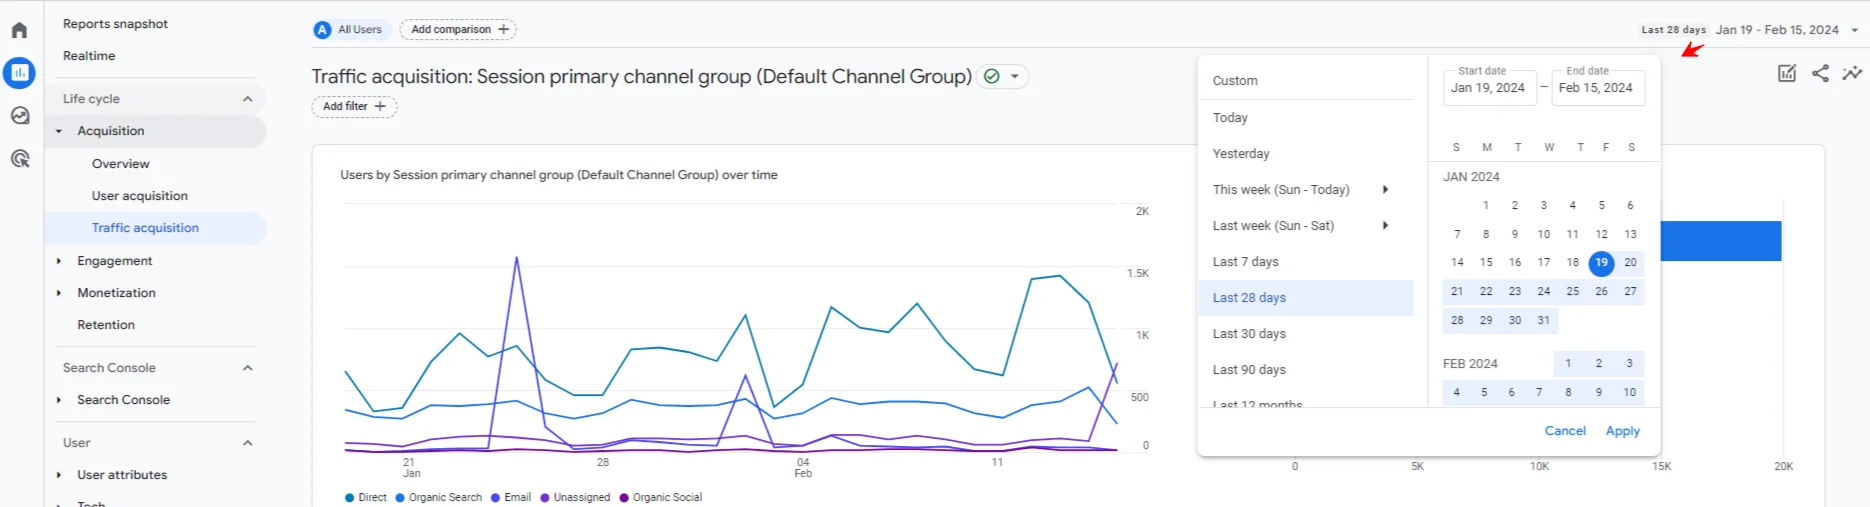
Specify the date range for analysis in one of the following ways:
- click on the first and last date of the required period in the calendar;
- write them in the appropriate column in the date range;
- select the default period.
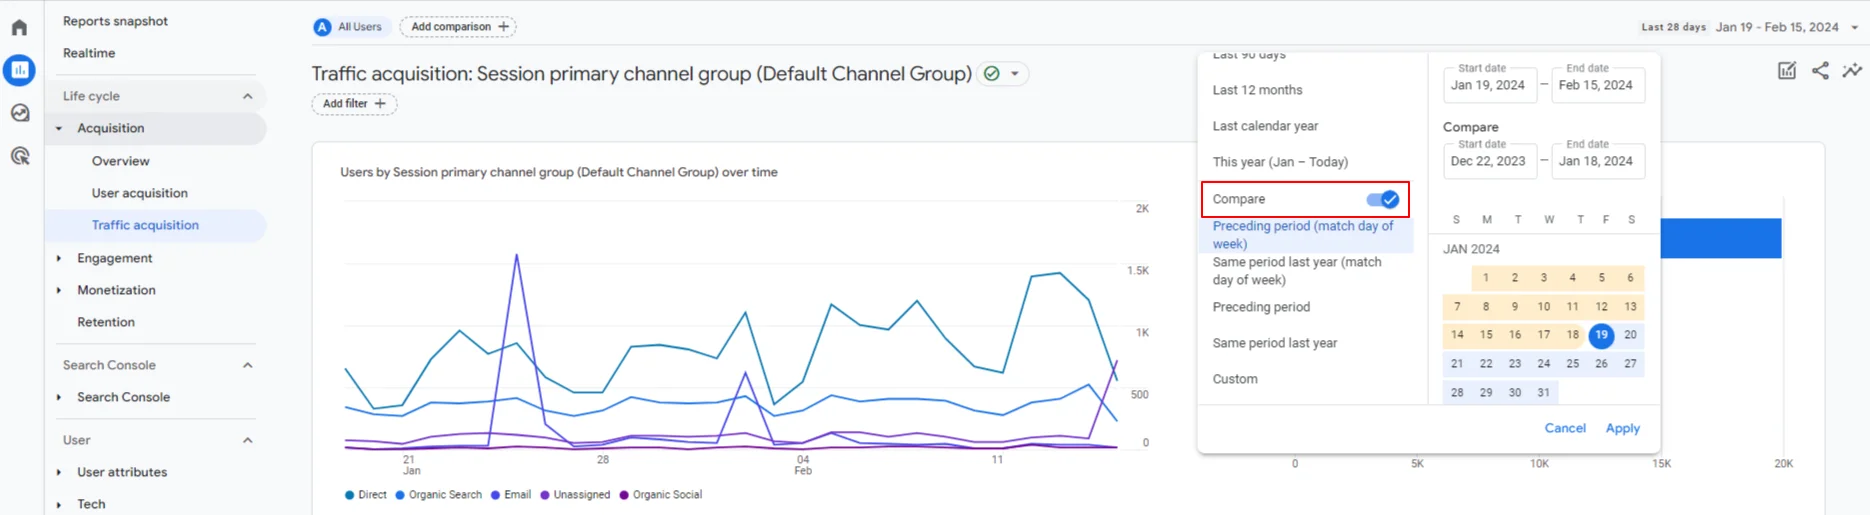
You can set two date ranges to compare the dynamics of results: check the Compare checkbox and specify the date ranges.
ImportantOf the channels available in Reteno, analytics by default only displays Email, SMS, and Mobile Push Notifications, where web push indicators are also collected. Other channels are included in the Unassigned or (other) statistics. Set up channel distribution manually.
Add UTMs to the list with utm_medium parameters to match them with the corresponding channel.
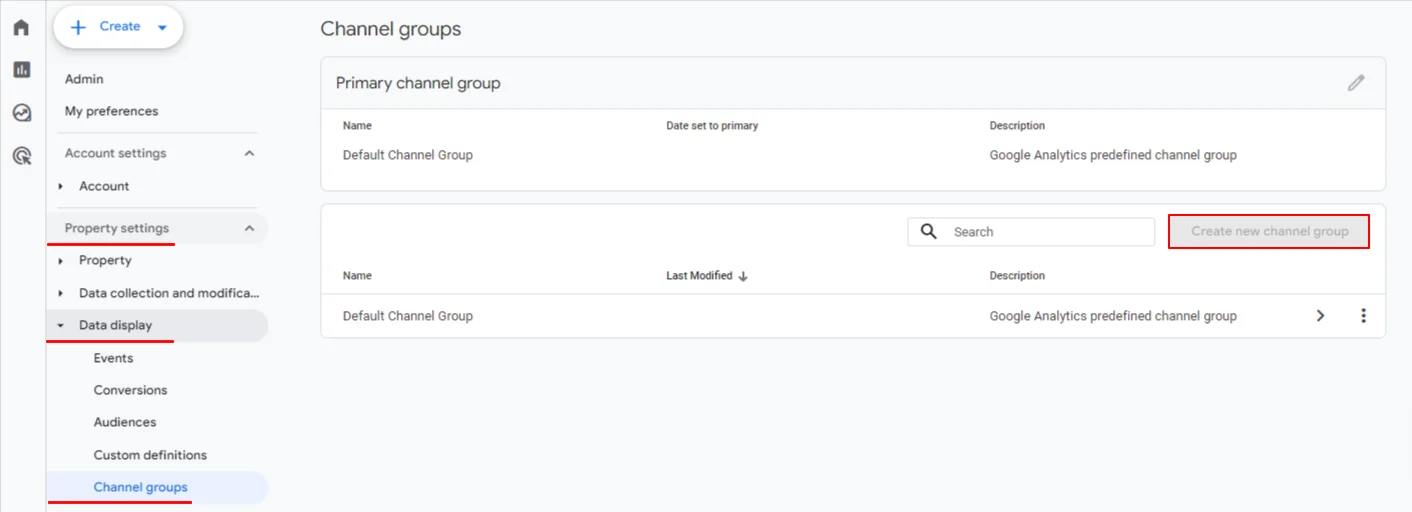
- At the bottom left, open the Administrator tab.
- Go to Property settings → Data display → Channel groups.
- Click Create new channel group (creating a new group is required to set the procedure for checking traffic data for compliance with the channel).
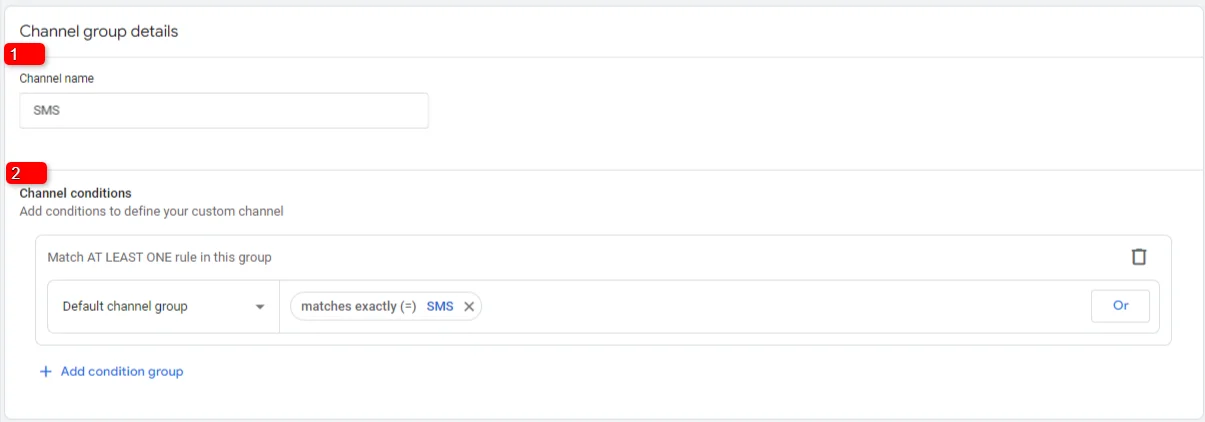
Provide channel information:
- Enter its name.
- Configure the rule by which you will transmit the channel in the medium parameter.
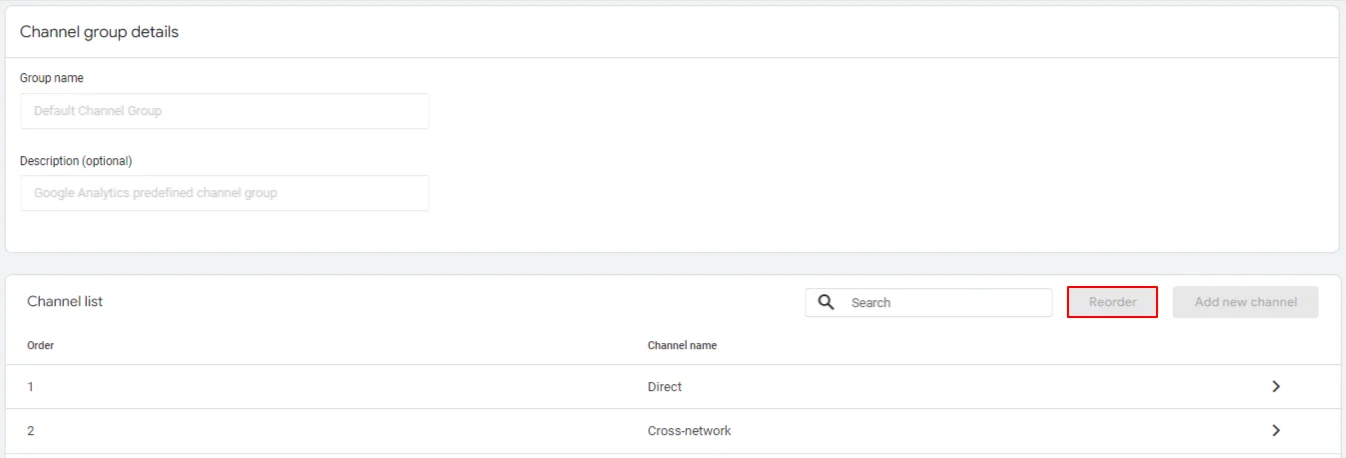
When creating a channel group, pay attention to the order in which they are placed. If the rule definition is repeated in channels, Google will record the traffic of the first channel in the list. For example, traffic is read as a referral, and if the Referral channel is higher in order than Social, place the channel definition you added above the others (the Reorder button). The data in the reports will be updated after 24 hours.
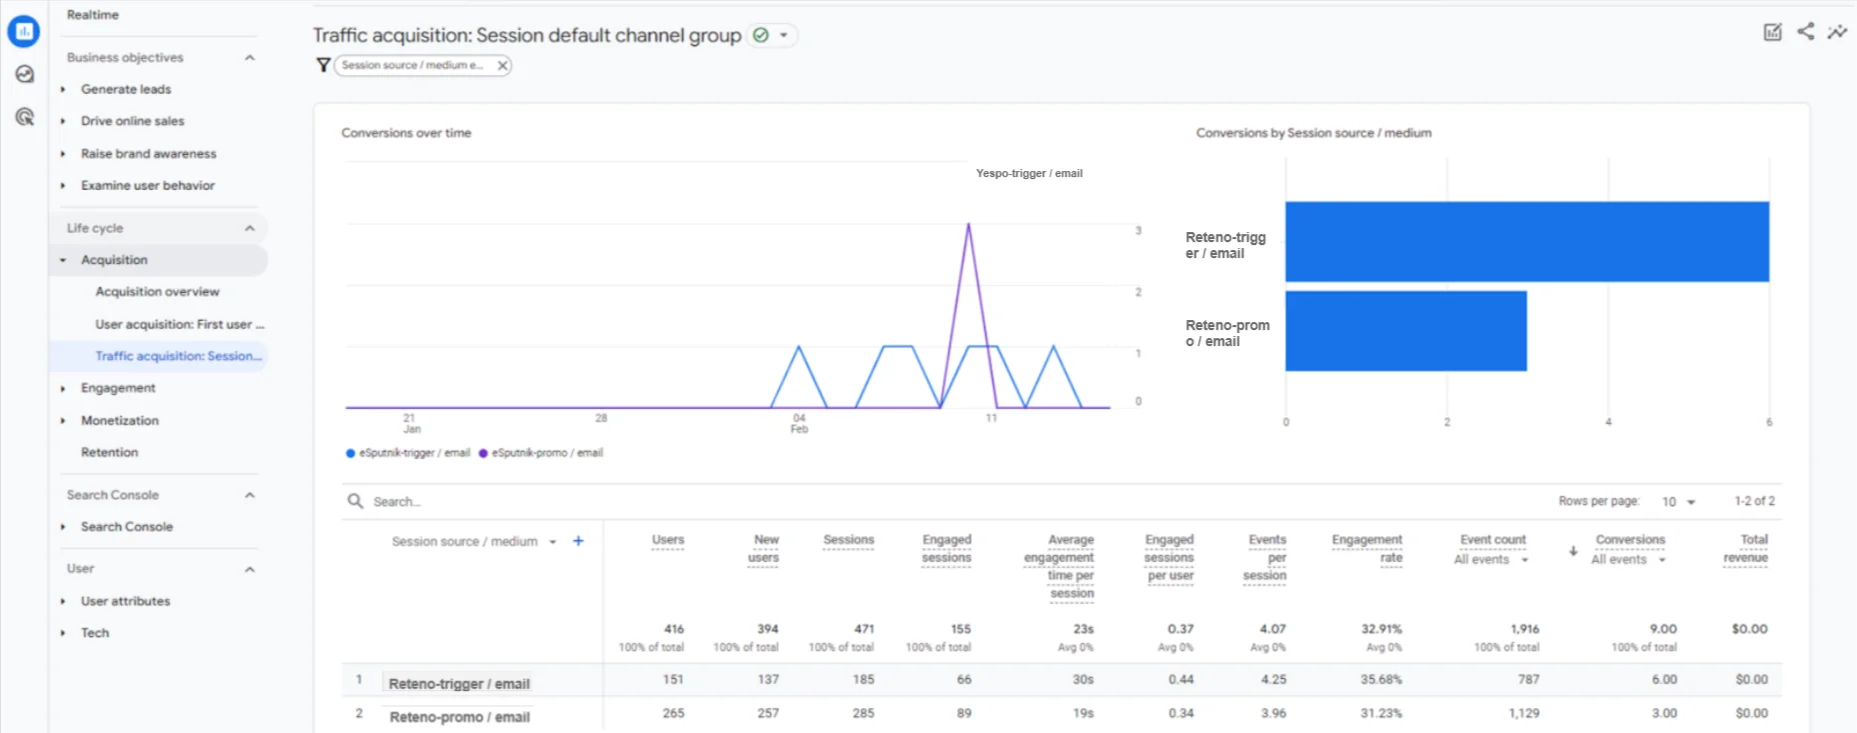
Trigger and Promo Campaign Analysis
Reteno transfers Reteno-promo and Reteno-trigger UTM tags, by which you can distribute the reports' data.
Open the Acquisition → Traffic acquisition tab, select Session source / medium from the list, and click Add filter.
Create a filter:
- Dimension: Session source / medium.
- Match type: exactly matches.
- Value: Reteno-promo / channel name and Reteno-trigger / channel name.
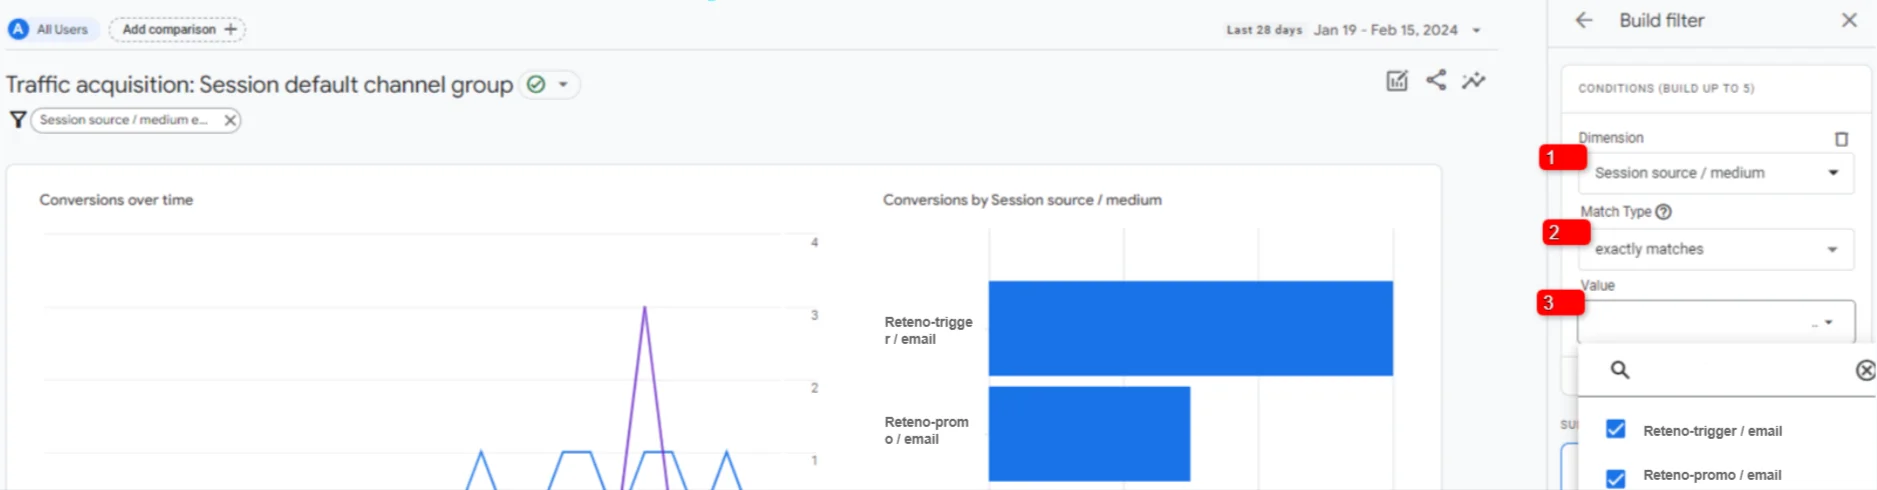
Apply filters and view the report.
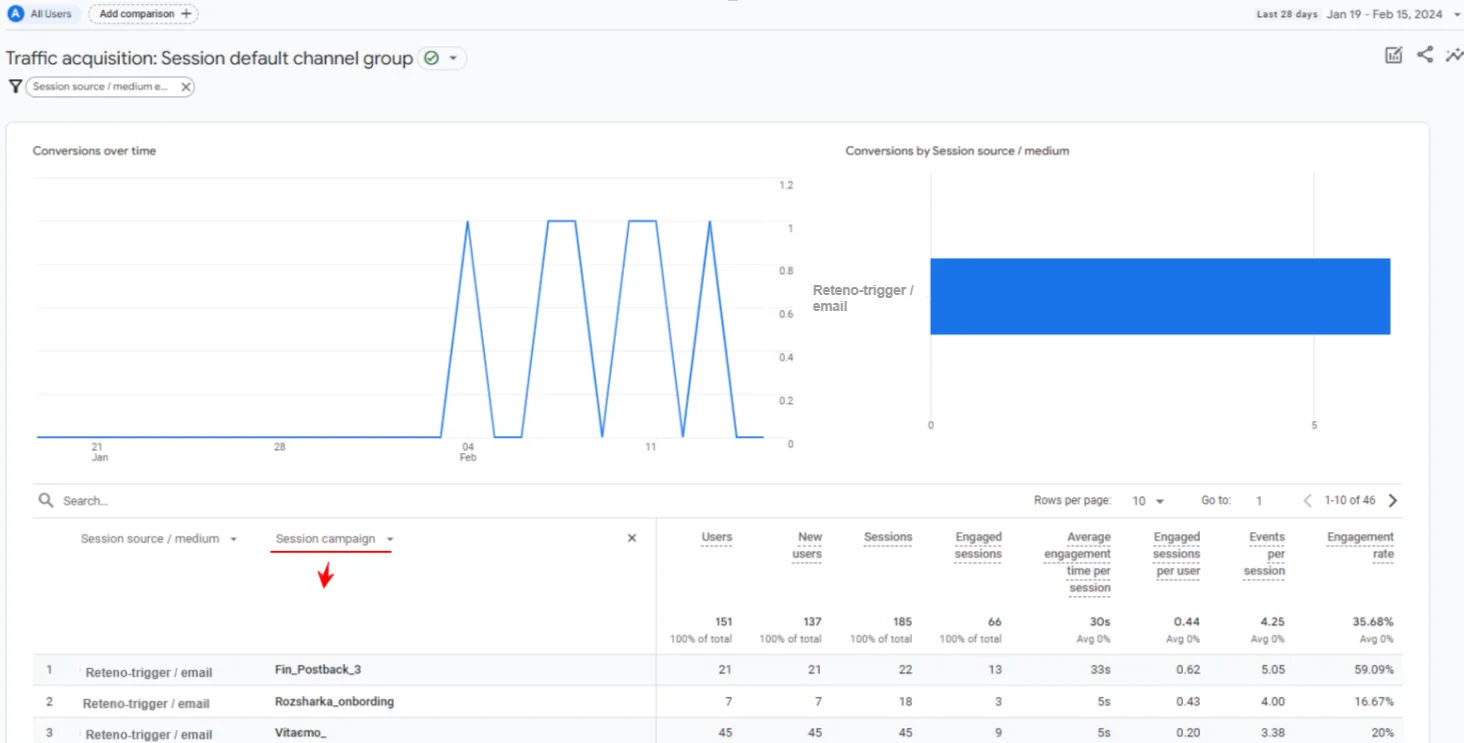
Single Campaigns Analysis
To evaluate the effectiveness of individual promo or trigger campaigns, apply the Reteno-promo / channel name or Reteno-trigger / channel name filters on the Acquisition → Traffic acquisition → Session source / medium tab. Select Session campaign in the Session source / medium column.
Messages’ Series Analysis
You can evaluate the effectiveness of a messages’ series by their tags in Reteno. All messages must have the same tags in the same number and order. Otherwise, GA will consider the messages to be from different campaigns.
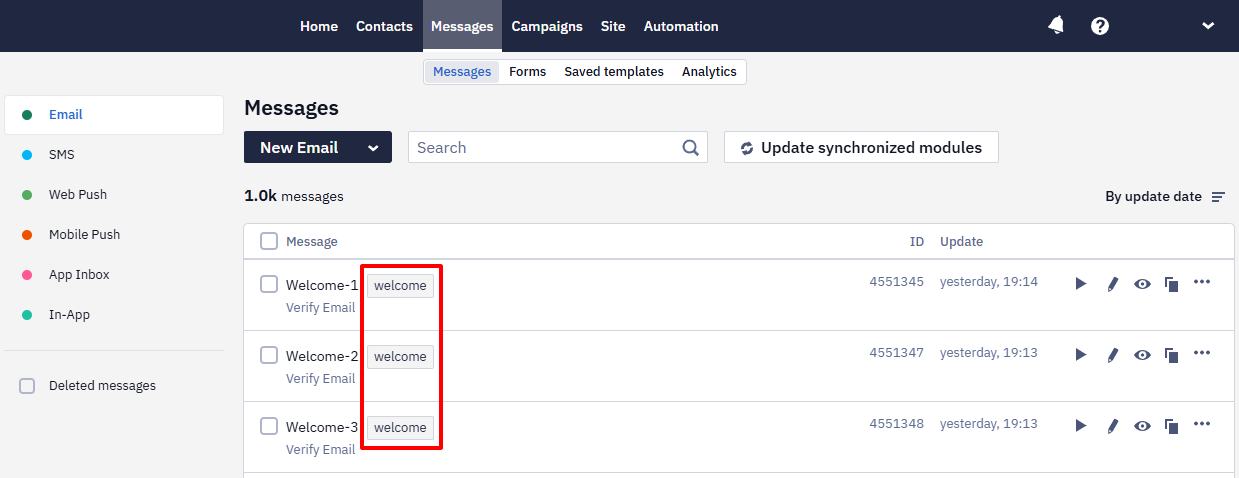
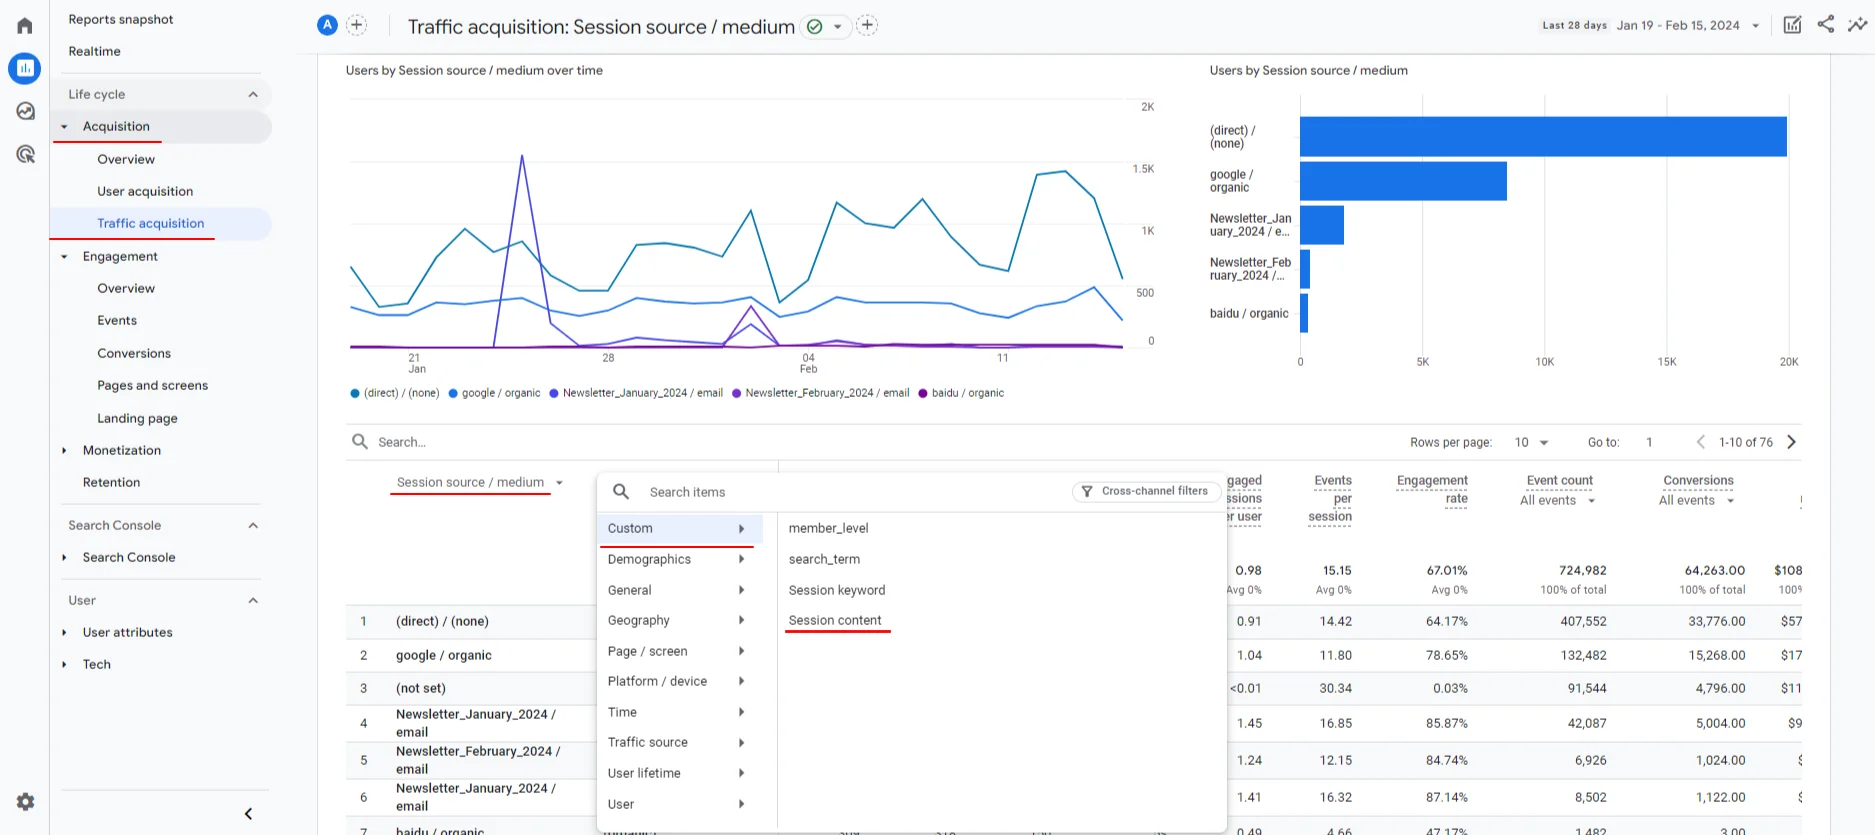
To evaluate the effectiveness of a series of messages, select the Session keyword parameter from the Custom list in the Session source / medium column on the Acquisition → Traffic acquisition tab.
If your GA4 account does not have a Session keyword parameter, set it up.
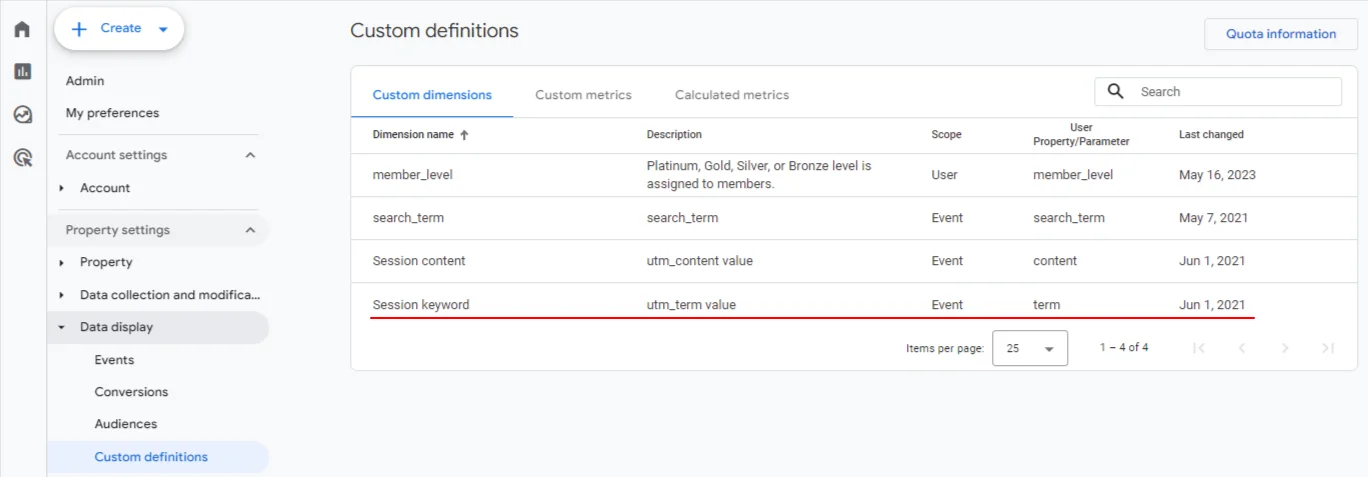
- Go to Property settings → Data display → Custom definitions in the admin panel.
- Create a custom definition on the Custom dimensions tab:
- Dimension name — Session keyword,
- Description – utm_term value,
- Scope — Event,
- User property/parameter – term.
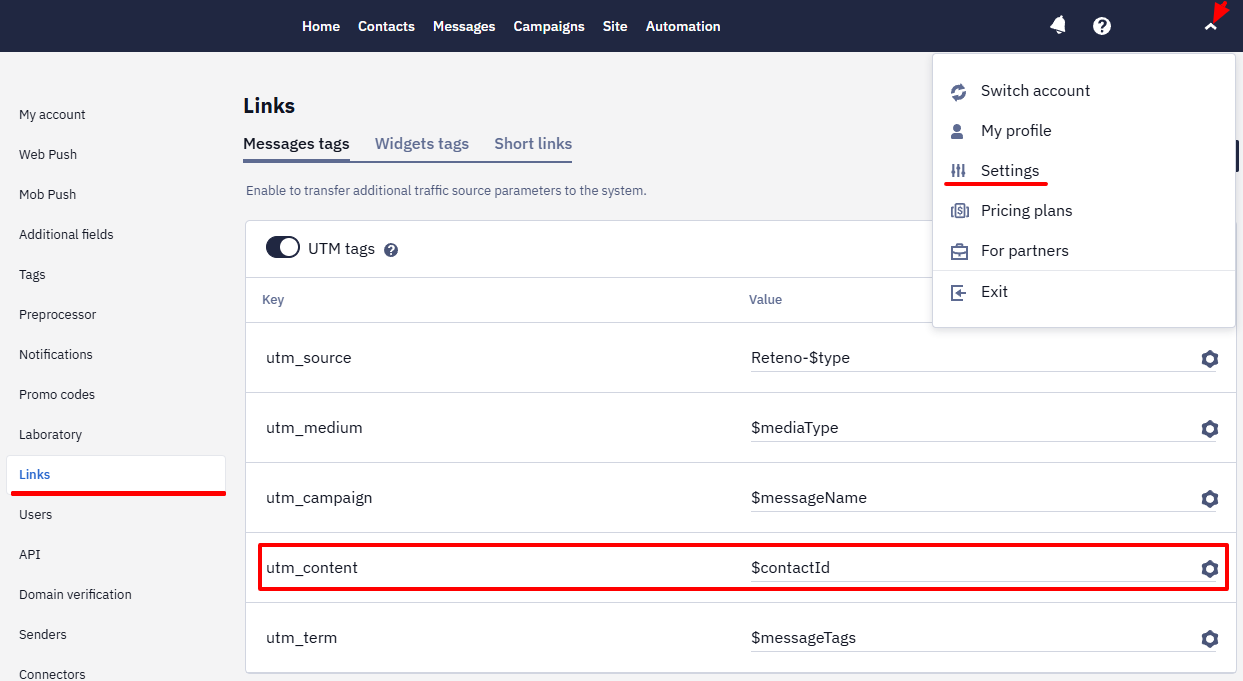
Contact Tracking by ID
You can track contacts’ purchasing activity using their external IDs.
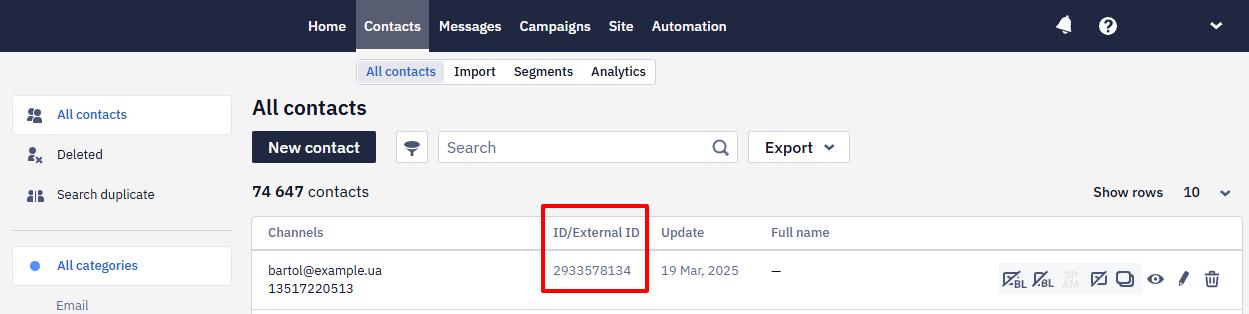
Pass the $contactId in the Contact ID parameter (Reteno settings → Links). It is included in the utm_content field by default.
To evaluate the contact's purchasing activity, select the Session content parameter from the Custom list in the Session source / medium column on the Acquisition → Traffic acquisition tab.

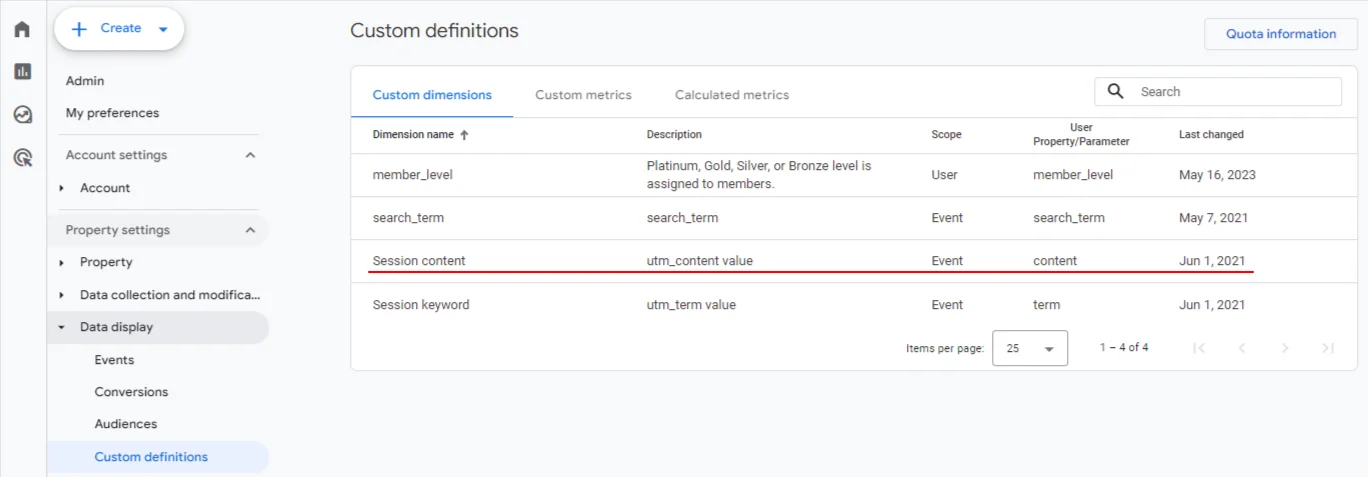
If your GA4 account does not have the Session content parameter, set it up.
- Go to Property settings → Data display → Custom definitions in the admin panel.
- Create a custom definition on the Custom dimensions tab:
- Dimension name — Session content,
- Description – utm_content value,
- Scope — Event,
- User property/parameter – content.
ImportantClient ID (cid) and User ID (uid) are used in GA and must be integrated into the site's tracking code. They help analyze user behavior, providing crucial information for overall analysis. Contact your developer or analyst for detailed information about these identifiers and their settings.
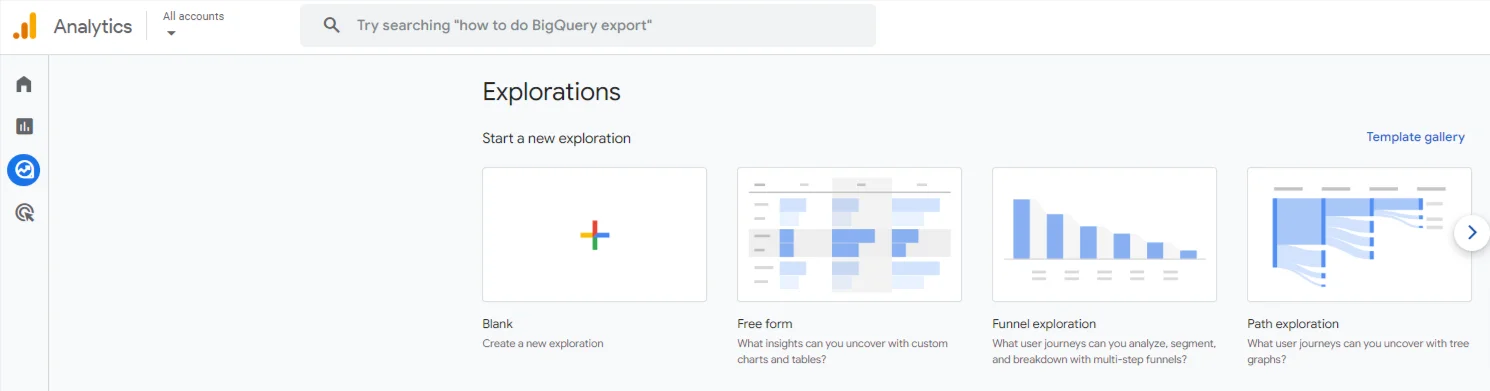
Explorations
Explorations are custom reports for tracking more detailed statistics on customer behavior.
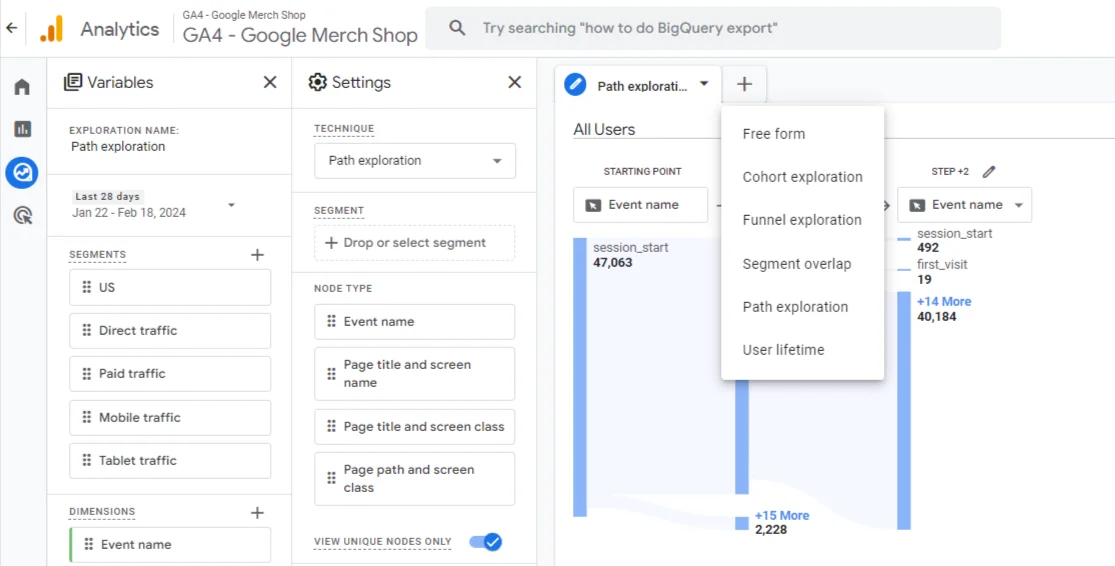
To create an exploration, go to the Studies tab and create a new exploration or select a template from the gallery.
You can use up to 10 tabs in one report with methods that optimally visualize data by different indicators.
Updated 4 days ago