
Segment Overview
Segment overview allows you to see the dynamics of base growth for selected segments. This way, you can see the effectiveness of marketing campaigns targeting specific groups of your audience.
Adding Segments for Tracking
-
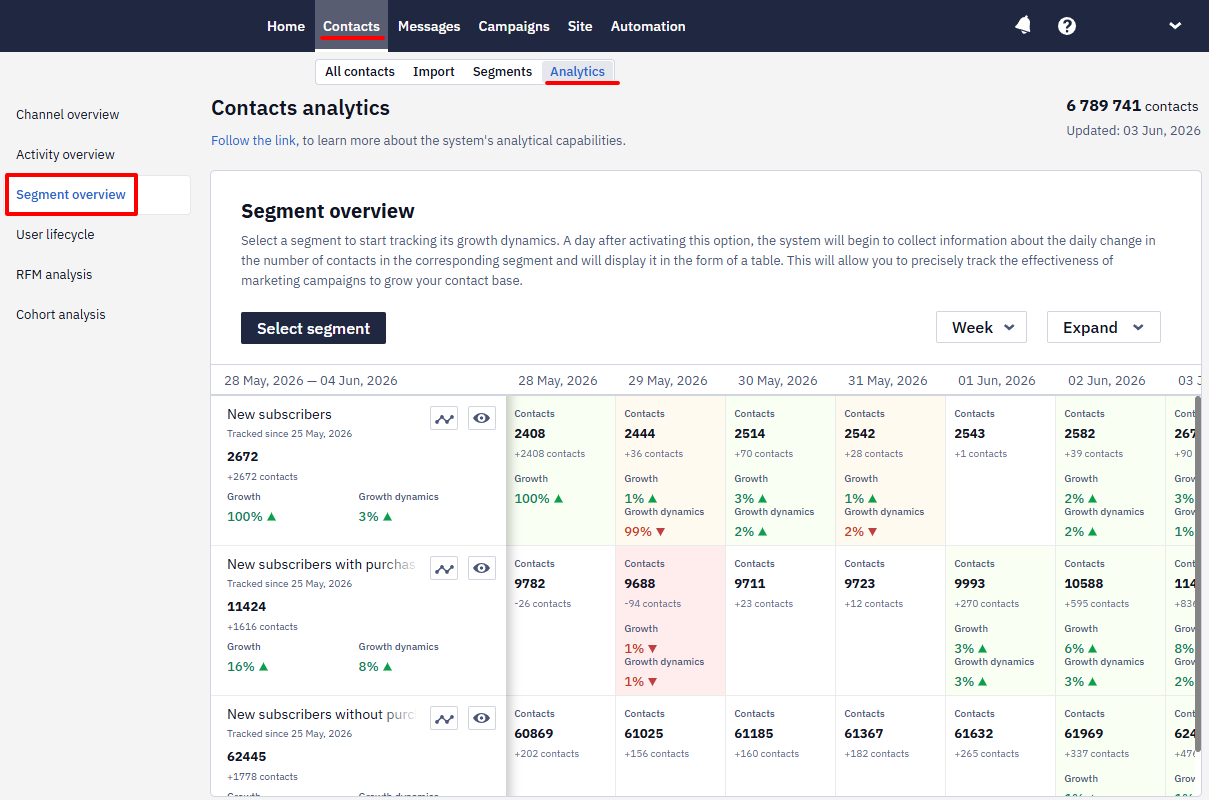
Go to the Contacts → Analytics section and find Segment overview in the general report.
-
By default, statistics for individual segments are not tracked. To start collecting data for analytics, click the Select segment button.
- Activate the switches opposite the desired segments.
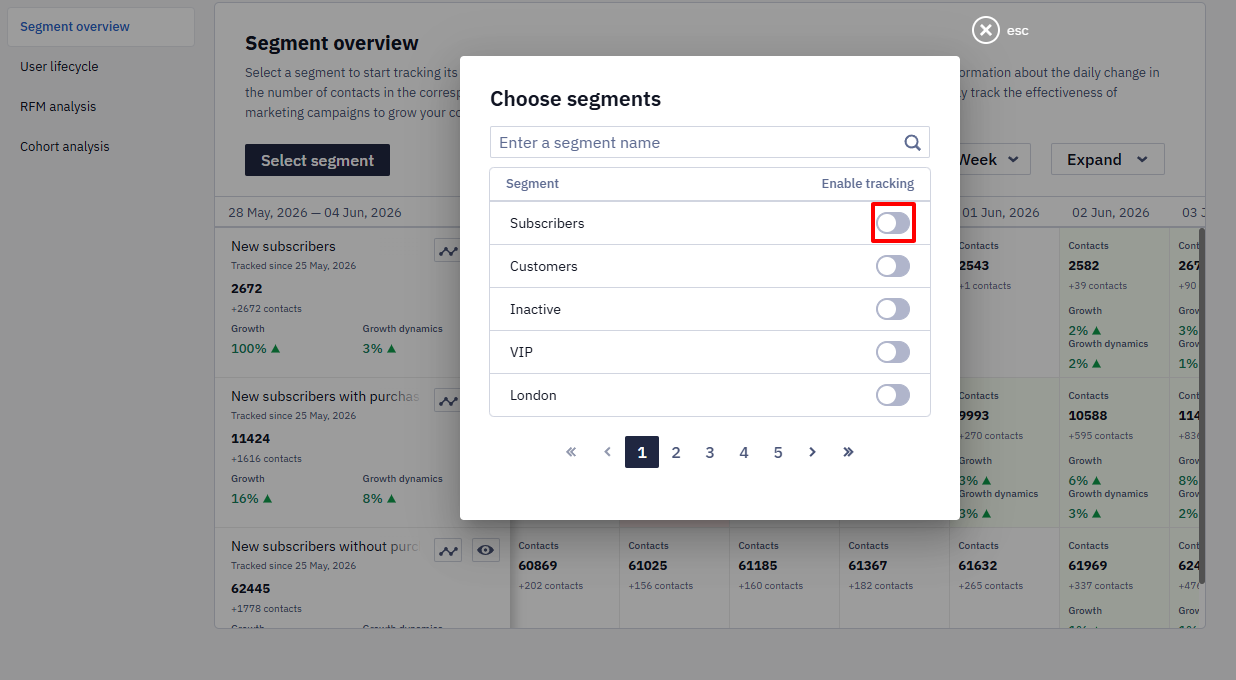
Data on changes in the number of contacts in the segment will appear within 24 hours.
Displaying Data
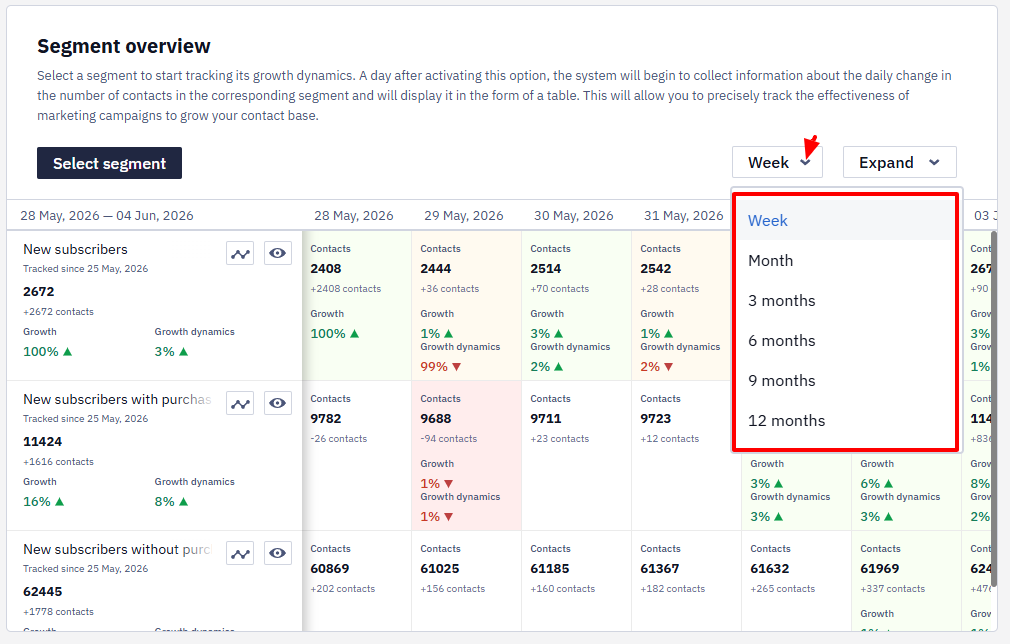
Select the period for which you want to view statistics.
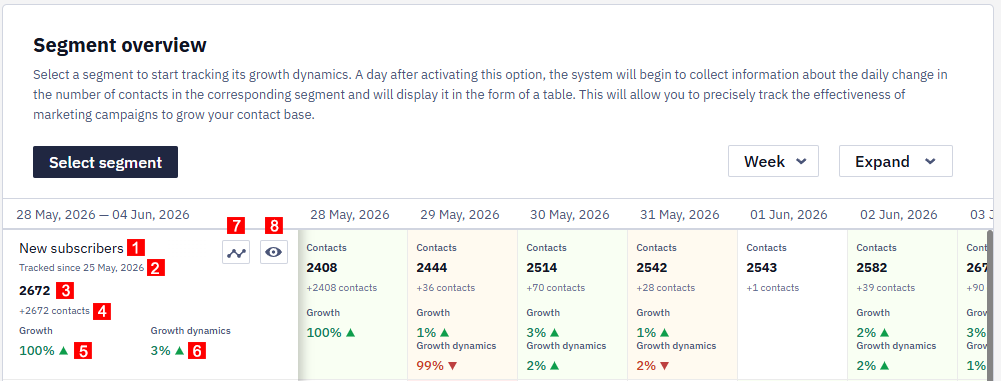
The first column displays:
- Segment name.
- Tracking start date.
- The number of contacts in the segment on the last day (recalculation ends at 02:00 UTC).
- The number of contacts by which the segment has increased or decreased.
- The segment's growth percentage at the end of the tracked period compared to the beginning.
- The percentage of the segment's growth dynamics at the end of the tracked period compared to its beginning.
- The button for viewing growth dynamics in the form of a curve.
- The button for segment preview.
Other columns of the table display the following data:
- The number of contacts in the segment on a specific date.
- The number of contacts added or deleted relative to the previous reporting date.
- The percentage of the segment growth relative to the previous reporting date, calculated using the formula: (current number of growth percentages - previous number/previous number) * 100%.
- The percentage of growth dynamics, calculated by the formula: the current number of growth percentages – the previous number.
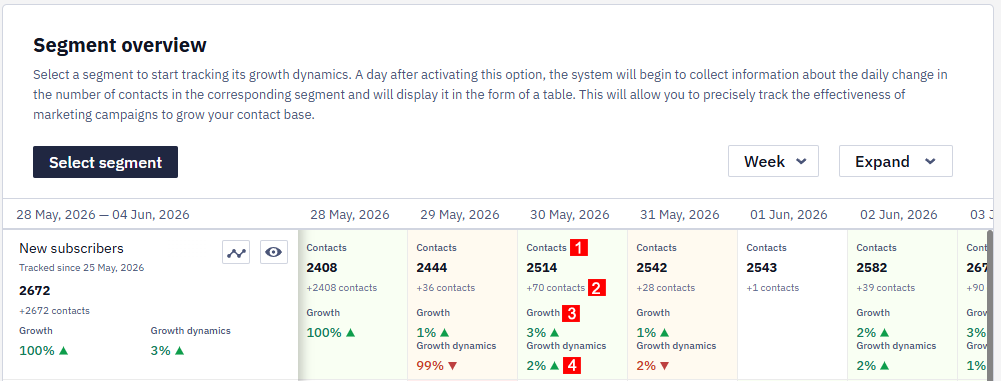
The shades of red and green in the color of the cells make it easy to see when significant changes have occurred in the segment size and to analyze marketing activities that occurred during the corresponding period.
If changes between reporting dates are less than 1%, growth percentages and growth rates are not shown.
NoteThe segment statistics display the number of contacts without considering the type of their IDs. If, for example, you want to track the number of email subscribers, configure the appropriate parameters in the conditional segment.
Updated 3 months ago