
Message Analytics
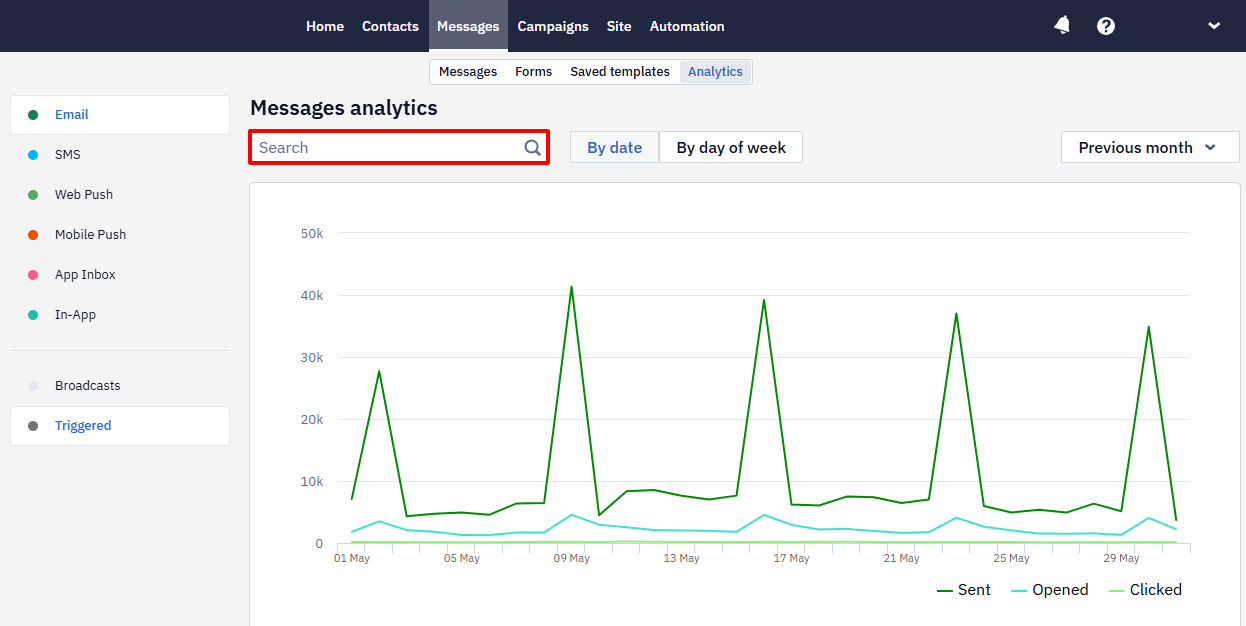
Go to Messages → Analytics to view message analytics.
The message analytics provides indicators of the effectiveness of triggered and roadcast campaigns and is available for all channels.
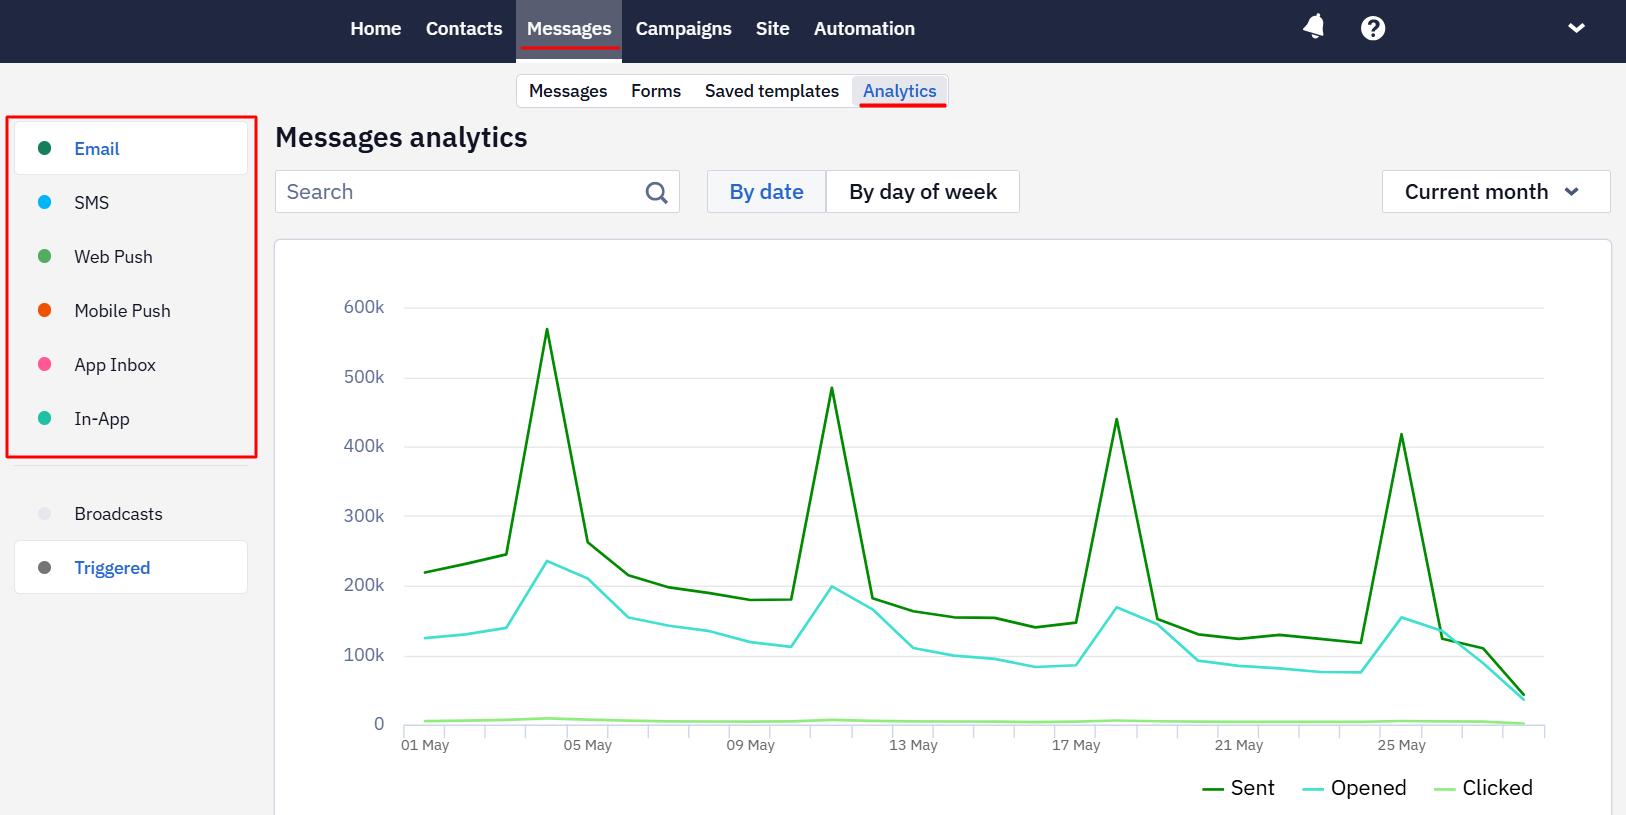
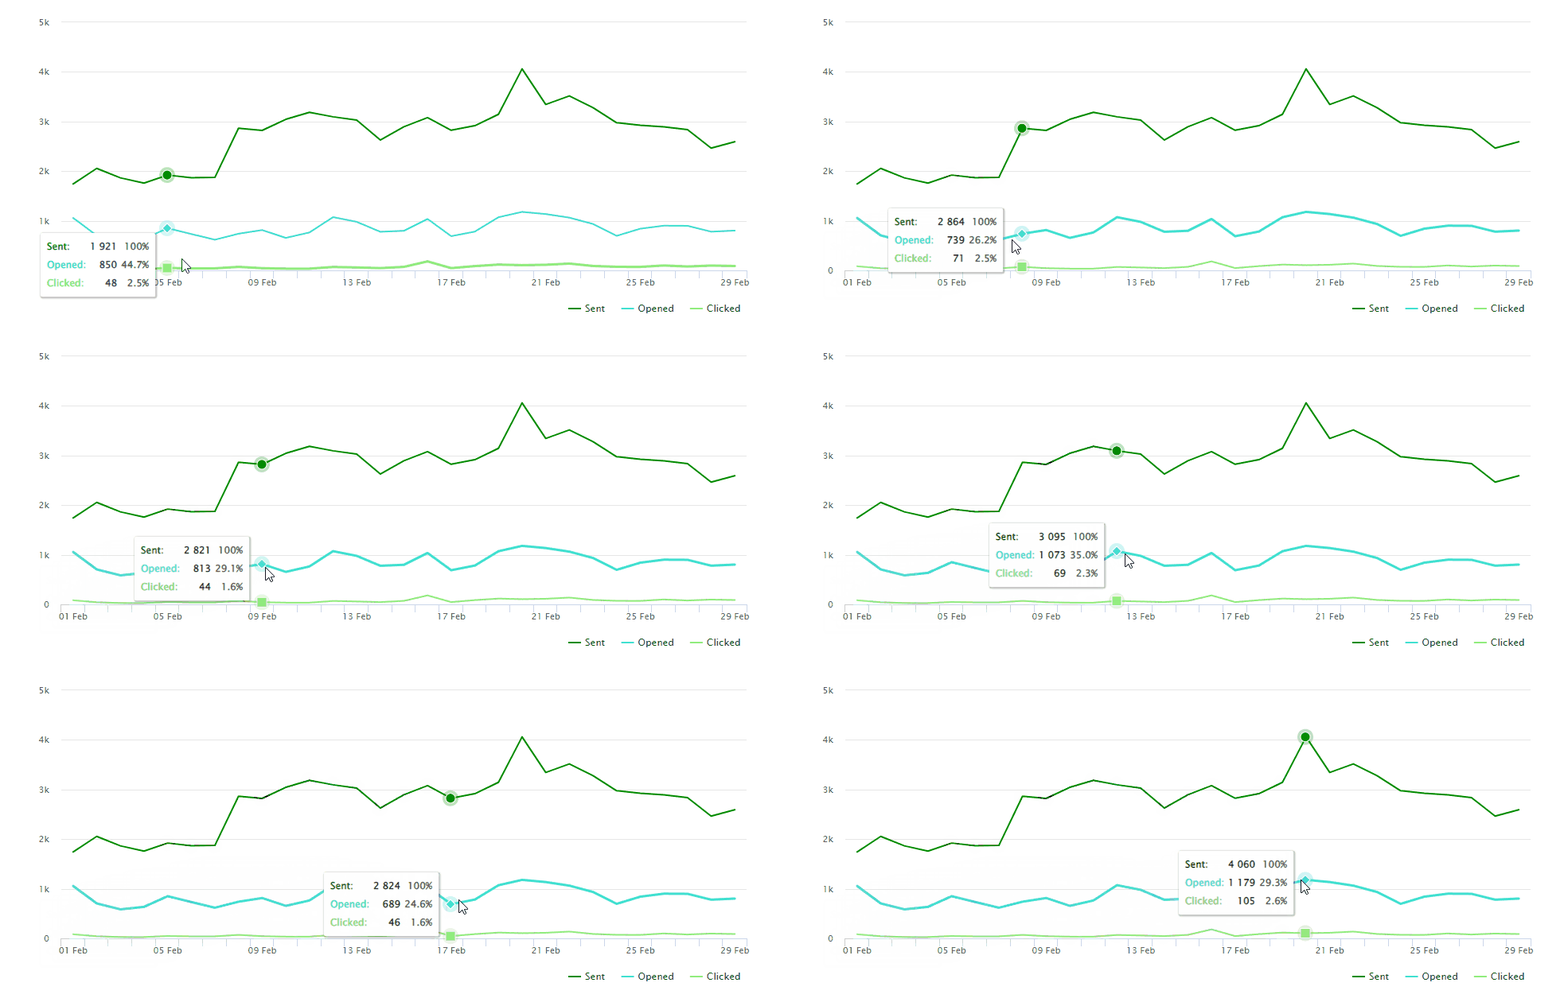
The analytics metrics display as linear graphs, showing points with values when hovering over the graph.
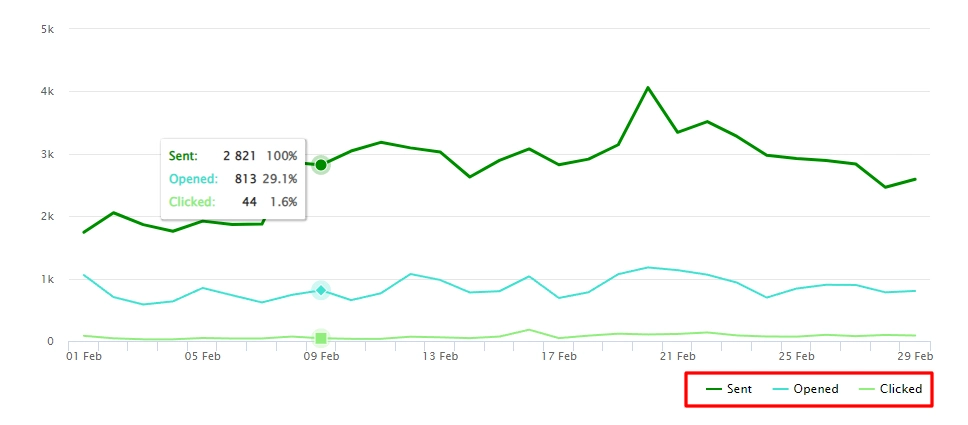
The top graph allows you to assess the level of interaction with the audience and contains the following metrics:
- Sent, opened, clicked — for Email, Web Push, and App Inbox channels
- Sent, clicked — for SMS, Mobile Push, and In-App channels
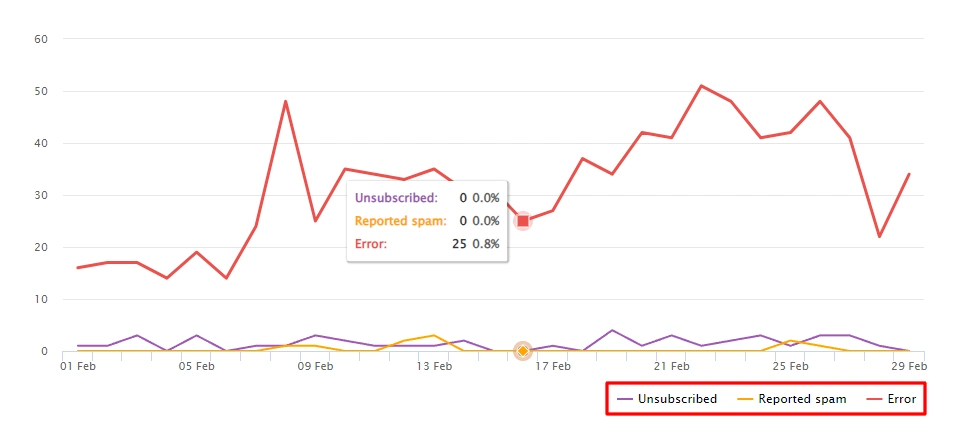
The bottom graph indicates issues or deficiencies that require attention and possibly adjustments in the communication strategy, containing the following metrics:
- Unsubscribed, reported spam, errors — for the Email channel
- Error — for all other channels
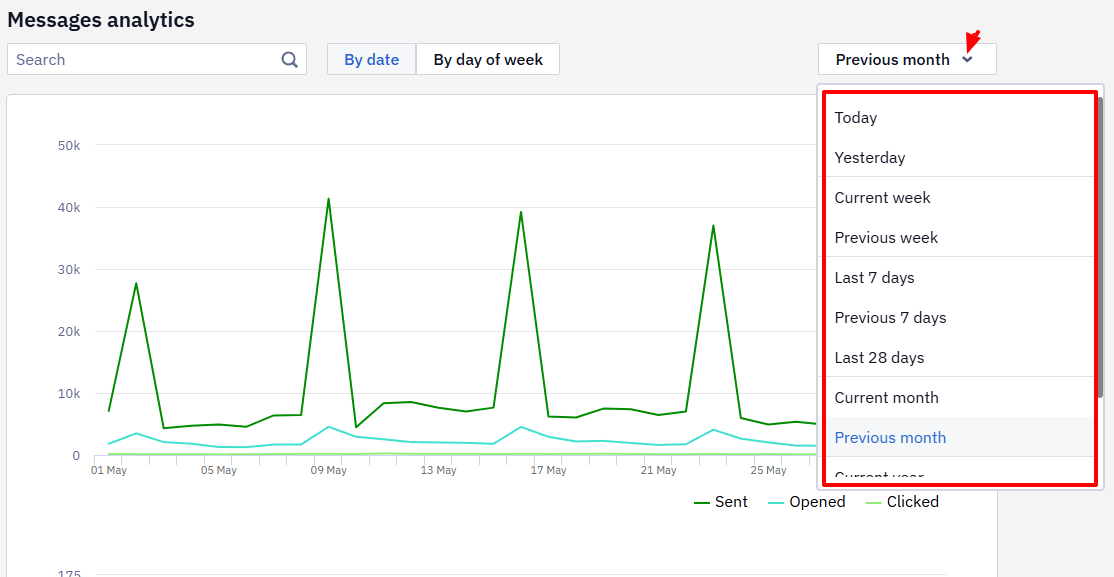
On the Period tab, select the desired time range to display analytics:
- Today
- 7 days
- 28 days
- Current month
- Previous month
Or set an interval covering a specific period.
To search the message in the list, use the search field by message tag.
Updated 3 months ago