
Deliverability Control Process
Monitoring and rules to follow when sending emails (and what happens if you don’t)
Deliverability isn’t just about a polished email or a clever subject line. It’s about the trust mailbox providers place in you as a sender — and that trust is built through subscriber behavior and the overall health of your list. A single misstep (for example, blasting inactive contacts, sharply increasing volume, sending low-relevance content, or ignoring list hygiene) can quickly hurt your domain or IP reputation. When that happens, emails start landing in spam more often, get throttled, or may be blocked entirely.
There are essential steps to take before you launch marketing sends — but that’s only the starting point. You should continuously monitor deliverability during every sending cycle.
That’s why Reteno uses a transparent process to monitor sending quality and apply gradual, predictable restrictions when needed. The goal is to:
- protect the platform’s IP reputation,
- maintain stable, predictable deliverability,
- help customers build a sustainable, long-term communication strategy.
Let’s walk through the process.
What You Need to Monitor During Sending
Here’s a practical set of indicators:
| Metric (during sending) | Why it matters | Healthy target | Needs attention | Stop & fix now |
|---|---|---|---|---|
| Spam rate | How many recipients reported your email as spam (or similar negative feedback, depending on the mailbox provider). It’s one of the strongest signals mailbox providers use to decide whether you belong in Inbox or Spam. | <0.1% | 0.1–0.3% | ≥0.3% |
| Bounce rate | How many emails could not be delivered because the recipient address/mailbox wasn’t accepted. Usually split into:
| <1.0% | 1–2% | 2% |
| Unsubscribe rate | How many recipients clicked unsubscribe (or used list-unsubscribe) and were removed from future mailings. | <0.3% | 0.3–1% | 1.2% |
| Open rate | Initial interest trend (but can be inflated by Apple MPP) | >20% (benchmark target) | 10–20% | <10% (or sudden drop vs your baseline) |
| CTR (click rate/click-through rate) | Crucial engagement signal (best “positive” metric during sending) | >1.2% | 0.8–1.2% | <0.8% (or sudden drop vs baseline) |
👉 How to Calculate Metrics
| Metric | Formula |
|---|---|
| Spam rate (spam complaint rate) | Spam rate (%) = (Number of emails reported as spam ÷ Number of delivered emails) × 100 |
| Bounce rate (total) | Bounce rate (%) = (Number of bounced emails ÷ Number of sent emails) × 100** |
| Unsubscribe rate | Unsubscribe rate (%) = (Number of unsubscribes ÷ Number of delivered emails) × 100 |
| Open rate | Open rate (%) = (Number of unique opens ÷ Number of delivered emails) × 100 |
| Click-through rate (CTR / click rate) | Click-through rate (%) = (Number of unique clicks ÷ Number of delivered emails) × 100 |
| Click-to-open rate (CTOR) | Click-to-open rate (%) = (Number of unique clicks ÷ Number of unique opens) × 100 |
NoteThe open rate is no longer a hard deliverability gate. Apple MPP can make emails look “opened” even when they weren’t, inflating open metrics.
How to Check Each Metric in Reteno (and what to do)
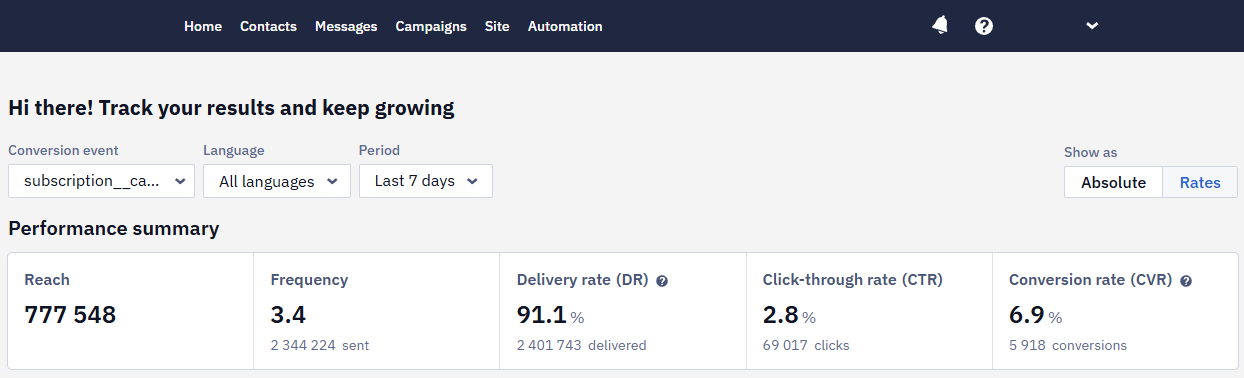
Option 1: General metrics. The Home dashboard provides an overview of all metrics. The dashboard consists of the Performance summary section and detailed statistics for each communication channel.
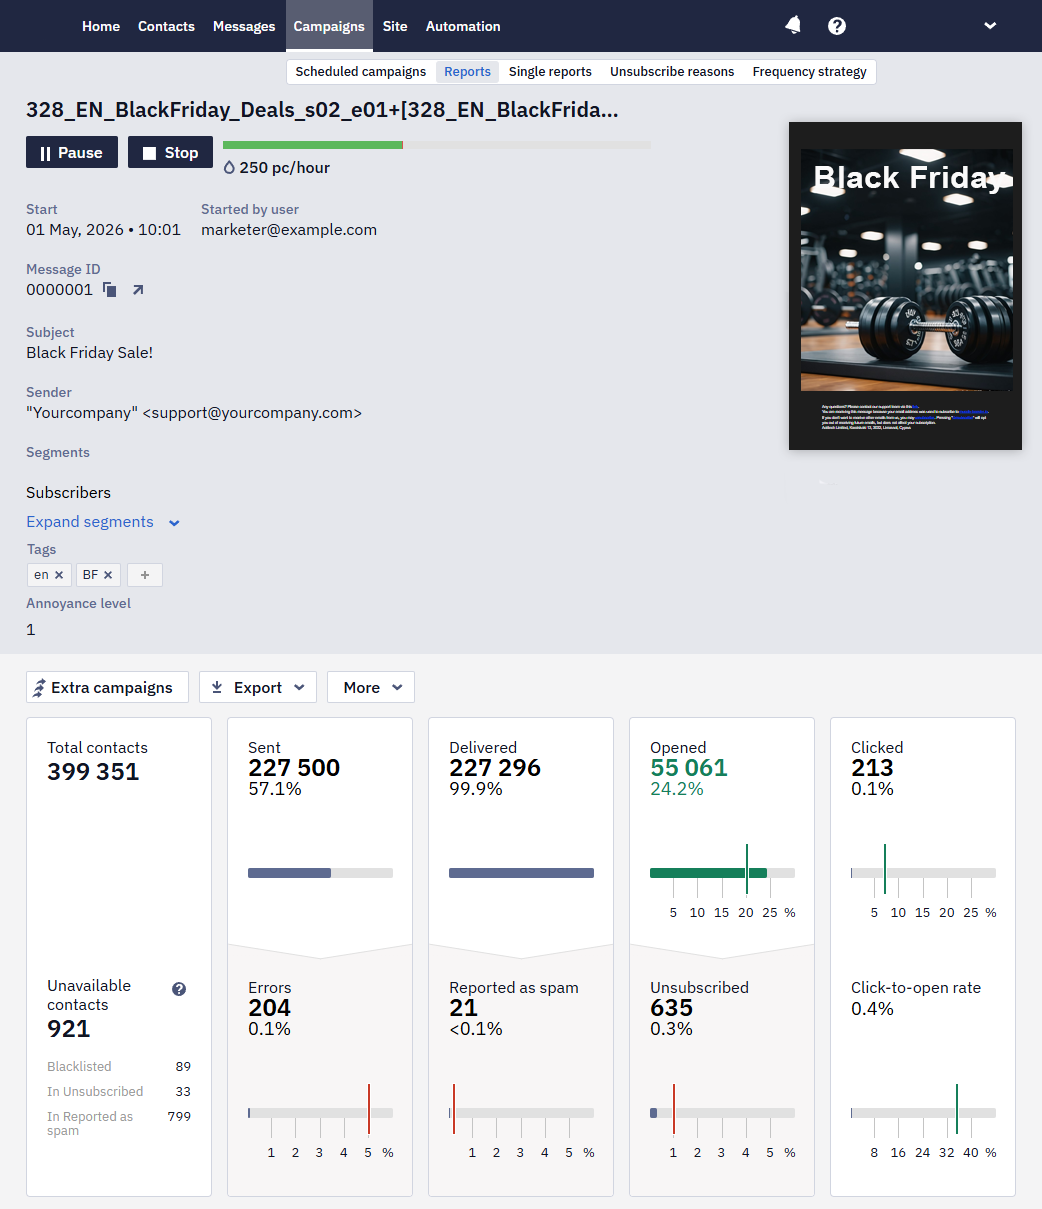
Option 2: Metrics for each email. Go to Campaigns → Reports → triggered or broadcasts. Reports provide complete statistical information in table format for each campaign.
What to Do if It Rises
Spam Rate
- Immediately pause further sends to the affected audience/campaign type.
- Switch to high-intent segments only (recent buyers/recent engagers).
- Reduce frequency (see Annoyance Level).
- Review content/expectations (subject line, unsubscribe clarity, etc).
Delivery issues (Errors, Unavailable, Bounce Rate)
- Throttle/slow down sending (especially if the volume jumped suddenly).
- Stop sending to cold segments and send only to recently engaged users.
- Check whether the spike is isolated to a single provider (e.g., Gmail vs Outlook) using performance indicators.
Unsubscribes
- Lower frequency (use the Annoyance level).
- Stop sending broadcasts to low-engagement users.
Open Rate/Click Rate (engagement)
- Check spam complaints + delivery errors first (those are the real “danger signals”).
- Compare Open Rate through the domains.
- Assume audience mismatch: tighten segments, reduce frequency, improve relevance.
Important nuance: open rate is increasingly noisy (Apple Mail Privacy Protection). Also, Google explicitly states it doesn’t track open rates and can’t verify third-party open rate data. (Google Help)
Use opens as a trend signal, not as a single-source “truth”.
How Often to Monitor All Metrics
During Every Send (After Every Broadcast or Significant Workflow Change)
- 15–30 min: check early “Errors” spike + initial complaint signals (if visible).
- 2 hours: check deliverability trend + unsubscribe trend.
- 24 hours: evaluate the whole picture (complaints, bounces, unsubscribes, engagement trend).
Weekly
- Postmaster Tools: spam rate + IP/domain reputation + delivery errors.
- Reteno Home dashboard: delivery rate + top broadcasts/workflows pulse.
Control Logic and Sanctions for Deliverability Violations
We use a simple 3-level control model.
Level 1 (Warning): if any key metric enters the warning zone, we mark the account as “under monitoring” and notify the client with recommendations (no restrictions yet).
Level 2 (Risk): if multiple metrics remain in warning or any metric reaches critical, we require a corrective action plan within a defined timeframe. We may apply soft limits (for example, email sending restrictions) to protect deliverability.
Level 3 (Enforcement): if the client ignores the plan or metrics don’t improve, we enforce technical restrictions, such as throttling, blocking the riskiest segments, or pausing email sending until the issues are fixed and performance stabilizes.
Restrictions are temporary and lifted after metrics stabilize.
Updated about 2 months ago